Refer a partner and get paid! Earn 20% of all qualifying subscriptions referred to our team 👉
Learn More

eCommerce Dashboard Template and Examples

Running ad campaigns for your eCommerce business?

Track key metrics and KPIs of all your ad campaigns from up to 650+ channels and measure their impact on sales and revenue.

Track your most important KPIs for all your ad campaigns in one place

Explore ready-made marketing reporting dashboard templates:
Performance Dashboard
Optimize for better financial performance on your PPC campaigns with a powerful dashboard tool. Find out which ad campaigns are working and which are underperforming and allocate budget accordingly.
Connectors used:
KPI Dashboard
Need an all-in-one tool to track all your important KPIs in real-time? A marketing dashboard visualizes both high-level KPIs and granular data. Find out how it works with ready-made templates.
Connectors used:
eCommerce Dashboard
If you are an eCommerce retailer running ad campaigns, you need an automated dashboard to monitor sales performance. Connect easily to our eCommerce dashboard for key revenue and conversion metrics.
Connectors used:

Need a custom reporting or dashboard template?
We got you covered.

Get your free custom template within 48 hours

Have a report you’d like us to replicate, or need some extra assistance? Get in touch with us and we’ll build a template within 48 hours free of charge to help you evaluate Adriel for your business’ specific goals.
Get a Demo

What is an eCommerce dashboard template?

An eCommerce dashboard template highlights key KPIs, trends, and relationships related to the performance of your eCommerce website and ad campaigns.
If you have ad campaigns for your online store, a ready-made web template will show you exactly how much revenue is generated from each ad channel, how much you spent on it, and what the conversions and return on investments on your ads are.

What type of information is displayed on the dashboard?

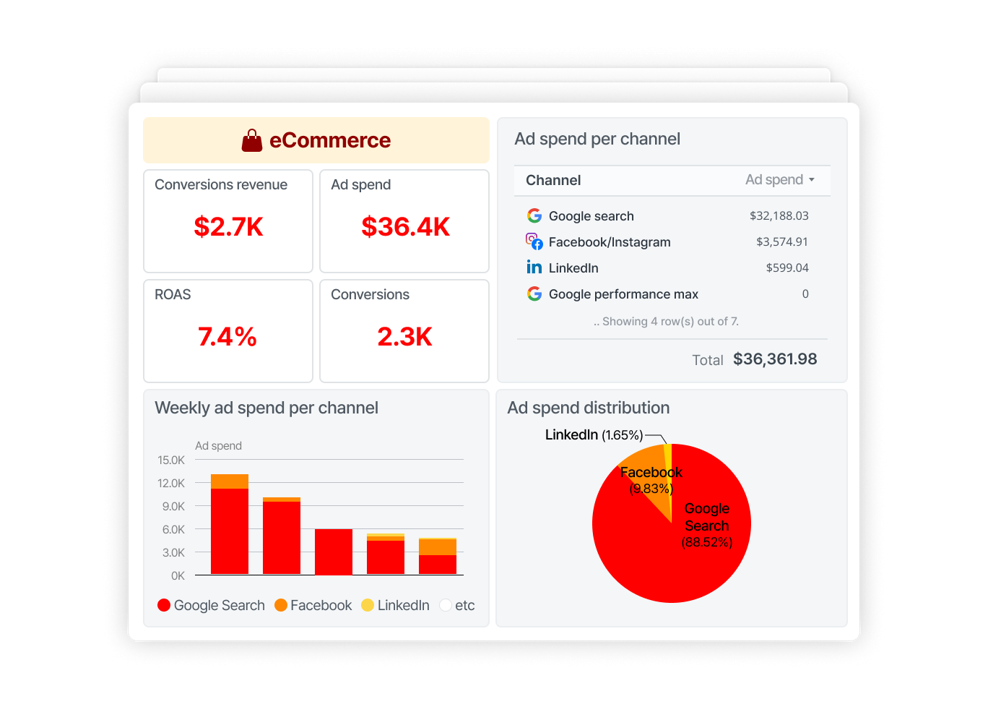
An eCommerce dashboard displays all the essential KPIs of your ad campaigns and how they contributed to sales and revenue on your online store. Here are some of them:

Daily / weekly trends per channel

Get an overview of the revenue, ad spend, ROAS, and conversions generated from your ad campaigns on each channel.

Revenue and conversions distribution

Find out which channels are generating the highest revenue and conversions and which are not performing as well.

Ad spend distribution

Know exactly how you’re spending your ad budgetand reallocate dollars right on the admin dashboard template.

Return on ad spend per channel

Measure how well campaigns are performing and what can be done to make the most out of the marketing budget.

What are the benefits of an eCommerce dashboard template?

Selecting an online retail platform like Shopify is only the first step to building a successful eCommerce web app. In today’s ever-changing market, having direct access to customized data-driven metrics and insights is more important than ever.

With eCommerce admin panel templates, you can uncover new ways to maximize sales and revenue with real-time insights on your ad campaigns and SEO efforts. Here are three main benefits of investing in one:

1. Manage cross-platform ad campaigns at scale

Dashboards pull large volumes of data from thousands of platforms through automatic plugins and centralize them on a single multipurpose admin template. This means you and your marketing team can manage ad campaigns efficiently without having to click in and out of different platforms multiple times a day.

Take Sery Box Healthcare – a Korean health and supplement company that advertises across five digital marketing channels: Facebook, Instagram, Kakao, Google, and Naver. The company uses 60 different advertising accounts with hundreds of ad creatives.
For Sery, using the cross-platform data management function on Adriel’s eCommerce dashboard proved to be an instant game-changer. Now, the team can easily cross-check the status and spending for each marketing channel without hindered communication.

It also meant less time spent on reporting and more time discussing key insights, ideas, and further marketing campaign strategies, which moved projects forward much faster and more effectively.

2. Optimize for ROAS with real-time data and custom alerts

When you have an automated tool that monitors key metrics in real-time, you can quickly take advantage of opportunities and fix issues as they arise.

On Adriel’s eCommerce website template, you’ll be able to set custom performance alerts that notify you instantly when an ad campaign goes above or beyond predetermined KPIs.

Quickly pull resources away from underperforming campaigns and ramp up investments into cash cows to see better ROAS for your online store.

3. A/B test creatives on a single platform to create better ads

Testing new messaging and creatives against specific audience groups is an integral part of your eCommerce or SaaS marketing strategy. A/B testing your ads helps identify the causal impact that a strategic change has on a given success metric.

On Adriel, you can conduct creative A/B testing right on your bootstrap admin template. Our Creative Intelligence Suite centralizes and visualizes the ad copy, titles, colors, and visuals that worked in attracting clicks and engagement, as well as those that didn’t perform well in previous campaigns.

How users are discovering you on Google
How long they are reading your content
How they’re interacting with pages on your website
How many times they visited you before converting
Here are the common site-centric data that marketers track:
No items found.

How do you make a KPI dashboard?

You should structure your marketing dashboard the way you write stories—with a clear beginning, middle, and end.
Divide your dashboard into three levels: top, middle, and bottom.
At the top, include:
  • Your brand / client’s visuals (name, logo, taglines)
  • Data stories
  • An overview of business metrics or compared with a specific time period
The middle section should analyze these KPIs in more detail:
  • Performance trends visualized in different types of graphs
  • Relationships between one KPI and another
  • Causes and effects
Finally, drill down to granular data:
  • Marketing mix
  • Details of ad campaignsAd creative insights (e.g. ad copy, photos, videos)Analysis of creative intelligence (e.g. keywords, colors, emojis)
  • Ad creative insights (e.g. ad copy, photos, videos)
  • Analysis of creative intelligence (e.g. keywords, colors, emojis)

What our customers are saying

Adriel made it easy for us to track our online ads across multiple platforms. The reporting process is now a lot more straightforward for my account managers, and our clients are in love with their new live dashboard. What a win!
J.Townley, Founder of Paparico
Marketing Agency
+140%
ROI
100%
Satisfied Clients
30h
Hours saved per week
Clicks Overview
Impressions
Impressions are the total number of times any of your webpages or your ads appear in search engine results and are viewed by users.

You can measure ad impressions through Adriel’s marketing dashboard across multiple ad channels, creatives, keywords, and audiences.
Link Clicks
Link clicks are the total number of times the links in your ad copy, call-to-action, or images have been clicked.

These links can lead to destinations within or outside of the platform where you’ve launched your ad, such as your landing page, social media profile, or a blog post. This is also a key metric for SEO.
Click-through rates (CTR)
Click-through rates measure the number of clicks you receive on an advertisement—per the number of impressions.

Generally, high CTRs mean that your ads were successful in attracting the attention of your target audience. High CTRs can also lead to lower advertising costs on advertising platforms like Google Ads. This article lists the average CTRs for all your favorite PPC channels.
Cost Overview
Cost-per-click (CPC)
Cost-per-click (CPC), similar to pay-per-click, is a popular programmatic advertising term where you pay an ad seller a cost every time someone clicks on an ad.

Different social media platforms, search engines, and programmatic publishers set different CPCs. They can range anywhere from $0.4 (Twitter Ads) to $6 (LinkedIn Ads). Get the average CPCs for your industry here.
Cost-per-mile (CPM)
Cost-per-mile (CPM) is the amount you pay for every 1000 impressions that your ad garnered. The CPM on different ad channels depends on a number of factors, such as the target audience, ad format, and the level of competition for ad space.
Cost-per-conversion (CPCV)
Everything comes with a cost, even conversions. Cost-per-conversion, or also known as cost-per-acquisition (CPA) pits the total revenue gained from an ad campaign against the total cost of that campaign.

CPCV is one of the easiest and most effective ways to determine if your ads are working. If your CPCV is too high, it could mean you have the wrong keywords, visuals, target audience, or channel. This is why it’s important to have a PPC reporting tool that lets you see super granular data as well as essential KPIs.
Conversions Overview
Conversions revenue
Revenue is the most rudimentary metric you can track on your report, but it helps you and your clients understand which campaigns or channels are bringing in money and which are draining your wallet. When you have this data, you can devise well-informed strategies in the future.

On Adriel’s PPC dashboard, you can view the total revenue for your ad campaigns across multiple digital channels, from LinkedIn Ads and Bing Ads to Walmart Connect.
Conversion rates (CVR)
Conversion rates (CVR) measure how many people took this desired action out of the total number of website visitors. Discover average CVRs by industry here.

Conversions are easier explained than measured, as they involve multiple circular paths from impressions to clicks to action on different marketing channels. But a PPC reporting dashboard reduces the hassle of having to go into each marketing channel and manually looking at each metric to arrive at conversions data.
Return on Ad Spend (ROAS)
When you pit revenue against ad spend, you get return on ad spend. ROAS measures the amount of revenue you earn for every $1 you spend on advertising. Find out what is regarded as a good ROAS ratio here.

Keeping track of your return on investment can be overwhelming when you have multiple campaigns running across different channels. Delegate the task to a reliable marketing dashboard but opt for one that comes with push notifications so that you don’t have to check back every ten seconds for potential fluctuations.

How do I report Meta Ads? What metrics do I show?

When reporting Meta Ads, you will want to visualize Instagram Ads and Facebook Ads performance side-by-side to understand how each platform is contributing to your digital marketing goals. Here’s how it looks like on Adriel’s report template:

Overview
An overview of key metrics on your Facebook and Instagram accounts.
Facebook
  • Followers
  • Fans
  • Impressions
  • Engagements
  • Reach
  • Profile views
Link Clicks
  • Followers
  • Engagements
  • Impressions
  • Profile views
Charts
A closer look at performance trends. Compare different metrics over a specific time period.
Facebook
  • Facebook Impressions/Profile views
Link Clicks
  • Instagram Impressions/Profile views
Posts
A deep dive of all your Instagram and Facebook posts.
Facebook
  • Facebook posts by
    • Impressions
    • Post engagement
    • Post comments
    • Post like
    • Post shares
Link Clicks
  • Instagram posts by
    • Impressions
    • Post engagement
    • Post comments
    • Post like
    • Post shares
Other metrics you can visualize:
  • Click-through rate (CTR): the ratio of impressions to clicks
  • Cost-per-click (CPC): the price you pay for each click on your Facebook ar Instagram ads
  • Cost-per-mille (CPM): the price you pay for every 1000 impressions
  • Conversion rates: the ratio of ad impressions or clicks that led to purchases or any other
    campaign goal
  • Cost-per-acquisition (CPA): the total cost of landing a new customer through Instagram or
    Facebook Ads

What is cross-platform analytics?

Cross-platform analytics refers to the ability to measure and analyze the performance of marketing campaigns across multiple platforms. This can include channels like:
  • Ad accounts: e.g. Google Ads, Meta Ads, LinkedIn Ads, etc.
  • E-commerce social platforms: e.g. Pinterest, Reddit
  • Programmatic platforms: e.g. Walmart Connect, The Trade Desk
  • Analytics tools: e.g. Google Analytics
  • Mobile analytics tools: e.g. AppsFlyer, Adjust
  • …and other sales and CRM tools
Check out our integration library to find out which platforms you can integrate to Adriel.
Cross-platform analytics helps agency owners and marketers identify areas where they need to make adjustments to optimize their ad spend. For instance, they can look at conversion and revenue figures and decide how to reallocate their budget across different marketing platforms.

What factors do we need to consider while making a digital dashboard?

To build an impactful cross-platform dashboard, you should consider:
The number of integrations
Most dashboard software in the market allows you to connect with anywhere from 60 to 600+ advertising and analytics platforms. The more connections, the better. Adriel supports integrations with 600+ channels and if there’s one that we don’t support natively, we can custom-make it for you.
Ease of use
It’s not just about the number of connections but also how easy it is to connect to these data sources.On Adriel, you can simply choose the platform you want to connect to from a drop-down list, and drag and drop widgets to start building your dashboards.
Real-time data
In a world where data is evolving every second, you need a dashboard that streams data as it comes in real-time so you can always see the latest campaign performance and take action in a timely manner.
Visualize ad creative data
Most dashboard software can show you all the main KPIs at a glance. But what if you want to dive deep into the details of your marketing campaigns? Adriel shows you granular data down to the ad level and allows you to report back on headlines, CTAs, and ad copies that led to higher conversion rates.
Alert system
Look for a dashboard software that alerts you whenever campaign metrics go above or below a certain KPI. With Adriel’s cross-channel alarm system, you can take advantage of opportunities and fix issues immediately.
White label reports
When it comes to client reporting, it’s very time-consuming to manually build complex dashboards in Google Data Studio or beautify your reports on PowerPoint. With Adriel, you can generate PDF reports with your brand visuals and client logos and colors within minutes.
1
Create an account
Book a Demo to get started. After your demo, we'll send you a link to sign up to Adriel for 14 days free. We'll also help you choose a pricing plan that suits your needs.
2
Connect data sources
Simply choose from a drop-down list to import dimensions and metrics from your ad accounts, analytics tools, and mobile measurement partners. See this page for a full list our integrations.
3
Visualize your data
Use our ready-made templates to instantly see all your KPIs in minutes. Or, start from a blank page and choose your data visualization widgets and graph types.

A Comprehensive All-in-One Social Media Dashboard to Monitor All Your Paid Media KPIs

Easily Track Paid Campaign Results in a Single eCommerce Dashboard

Integrate all your paid ad channels’ results into one eCommerce dashboard.
Curious to know how your Meta, Google, or TikTok Ads are performing? Connect all of these platforms to Adriel, and in less than 5 minutes, show all of your paid campaign results in one unified dashboard. See our integrations page for more information.

Create an Insightful eCommerce Dashboard Using Our Pre-made Templates

You can start from a blank page to create an eCommerce dashboard, but what if you don’t have time? Our extensive pre-made eCommerce dashboard library has everything you might need.

Try Adriel, and you’ll have more time to research ways to increase conversion or optimize your landing pages.

eCommerce Reporting Tool

Our software was expertly designed with powerful functions for marketers. But everything can be customized. Adriel’s flexibility allows you to change all aspects of the dashboard design and appearance. Impress your clients or manager with a professional eCommerce dashboard report for an expert brand image.

Other Dashboard Examples

PPC Dashboard
Have pay-per-click campaigns on different channels? A PPC dashboard aggregates and displays all your key insights in one place so you can optimize for higher ROAS.
Social Media Dashboard
Paid social campaigns are critical for brand awareness and conversions. See marketing dashboard examples to track campaign performance in real-time.
Manager Dashboard
Keep on top of all the critical information the management needs to know in order to make decisions with our ready-to-go manager dashboards.

Why Leading Advertisers Choose Adriel

Eliminate manual reporting
Spend more time acting for impact and less time on repetitive tasks
Foolproof your data
Say goodbye to data translation risks with automated data transfers and harmonization
Get real-time alerts
Automatically track KPIs and insure all your campaigns against unforeseeable errors
Drive better performance
Access a full suite of creative intelligence tools designed to help you maximize performance
White label your work
Generate beautifully branded reports your clients will love in minutes
Offer better services
Get more time to do what you love and build more trustworthy relationships

What our customers are saying:

Revenue
+170%
Management Cost
-20%
Hours saved per week
45h
I was always asking for reports from my teams but by the time I got them it was too late to capitalize on some important insights, which hindered our growth. Now I just sign in to Adriel and see everything for myself as it happens.
J.Riley, CEO of Edge
Digital Agency
ROI
+140%
Satisfied Clients
100%
Hours saved per week
30h
Adriel made it easy for us to track our online ads across multiple platforms. The reporting process is now a lot more straightforward for my account managers, and our clients are in love with their new live dashboards. What a win!
P. Townley Jones, Founder of Paparico
Marketing Agency

FAQs

All your questions answered. And if you can’t find it here, chat to our friendly team.
How many widgets does the template offer?

Adriel’s dashboard template offers six main types of widgets:

  • Pivot tables: Categorize your campaigns, ad sets, and ads with your choice of metrics and dimensions. Create custom breakdowns per product, market, or promotion to go even further in analysis.
  • Single metric widget: Structure your dashboard in an intuitive way and track down individual KPIs you’d like to keep close tabs on. Compare performance with past data and see trends.
  • Notepad widget: Organize all your thoughts by means of visual elements such as text, images, or videos along with the KPIs on your dashboard, which streamlines communication with ease.
  • Creative widget: Customize your KPIs displayed on creative cards and obtain in-depth insights for the best and worst-performing ad creatives across your client’s digital marketing channels.
  • Draggable widget: Zoom in on specific marketing metrics and visualize trends and relationships. Just drag-and-drop widgets directly from the side panel onto your workspace for easier access.
  • Resizeable widget: Adjust the height or width of a certain widget within the constraints of your workspace and fine-tune how much information or types of data you want to see on each widget.
Which KPIs should I track on my eCommerce dashboard?

Apart from revenue, ad spend, ROAS, and conversions, you can also track these KPIs:

  • Cost per lead
  • Cost per acquisition
  • Click through rate (for traffic-focused campaigns)
  • View through rate (for video campaigns)
  • Cost per view
  • Clicks and online engagement
  • Website traffic
Can I also track data from Google Analytics on my eCommerce template?

Yes, you can. Adriel supports integrations with 5000+ data sources on the backend, ranging from:

  • Ad accounts: Facebook Ads, Google Ads, TikTok Advertising, etc.
  • E-commerce social platforms: Pinterest, Reddit
  • Programmatic platforms: Walmart Connect
  • Analytics tools: Google Analytics
  • Mobile analytics tools: AppsFlyer, Adjust
  • …and other sales and CRM tools

Check out this page for a full list of integrations.

Take control of your marketing data today

Thank you! Your submission has been received!
Oops! Something went wrong while submitting the form.
Don't Go!
Book a 1:1 Demo Instead.
We’ll help you optimize your Ad Operations processes and save thousands of dollars every month on ad spend and reporting.
Thank you!
You will be redirected shortly.
Oops! Something went wrong while submitting the form.