Refer a partner and get paid! Earn 20% of all qualifying subscriptions referred to our team 👉
Learn More

Executive Dashboard Template and Examples

Quickly see an overview of key metrics and make decisions in a snap. Tell compelling stories about how ad campaigns led to better business performance.

Track your most important KPIs for all your ad campaigns in one place

Explore ready-made marketing reporting dashboard templates:
Performance Dashboard
Optimize for better financial performance on your PPC campaigns with a powerful dashboard tool. Find out which ad campaigns are working and which are underperforming and allocate budget accordingly.
Connectors used:
KPI Dashboard
Need an all-in-one tool to track all your important KPIs in real-time? A marketing dashboard visualizes both high-level KPIs and granular data. Find out how it works with ready-made templates.
Connectors used:
eCommerce Dashboard
If you are an eCommerce retailer running ad campaigns, you need an automated dashboard to monitor sales performance. Connect easily to our eCommerce dashboard for key revenue and conversion metrics.
Connectors used:

Need a custom reporting or dashboard template?
We got you covered.

Get your custom template within 48 hours

Have a report you’d like us to replicate, or need some extra assistance? Get in touch with us and we’ll build a template within 48 hours to help you evaluate Adriel for your business’ specific goals.
Get a Demo

What is an executive dashboard?

An executive dashboard template is a ready-made data visualization and reporting tool that aggregates real-time data from multiple sources and displays key metrics.
Various stakeholders in an organization, from CEOs to CFOs, will be able to quickly see an overview of key performance indicators and make data-driven decisions.

What should be included in an executive dashboard template?

An executive operational dashboard should present a high-level overview of performance metrics of your ad campaigns.

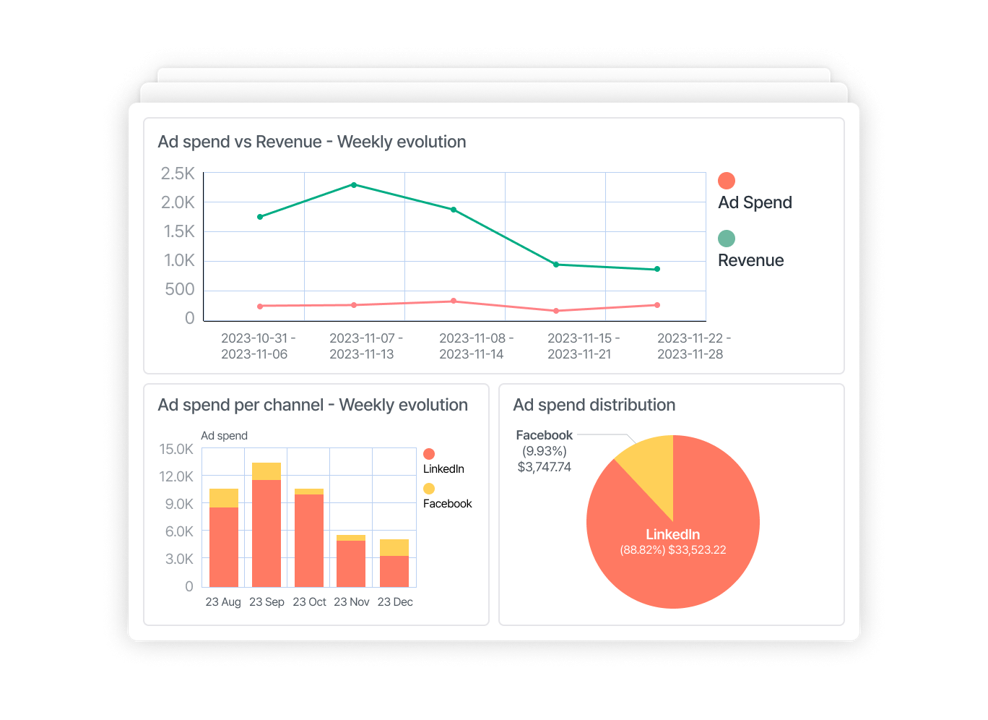
Some important metrics include:

Ad Spend

Find out exactly how much you’re spending on each ad channel and monitor the financial data weekly.
Get instant notifications if ad spend goes above a certain limit.

Revenue

Uncover which marketing investments are paying off the most.  Get actionable insights on which ad channels to focus on in the future.

Conversions

Drill down into the channels that convert well and those that are flopping on your business dashboard.
Compare weekly conversions per channel.

How users are discovering you on Google
How long they are reading your content
How they’re interacting with pages on your website
How many times they visited you before converting
Here are the common site-centric data that marketers track:
No items found.

How do you make a KPI dashboard?

You should structure your marketing dashboard the way you write stories—with a clear beginning, middle, and end.
Divide your dashboard into three levels: top, middle, and bottom.
At the top, include:
  • Your brand / client’s visuals (name, logo, taglines)
  • Data stories
  • An overview of business metrics or compared with a specific time period
The middle section should analyze these KPIs in more detail:
  • Performance trends visualized in different types of graphs
  • Relationships between one KPI and another
  • Causes and effects
Finally, drill down to granular data:
  • Marketing mix
  • Details of ad campaignsAd creative insights (e.g. ad copy, photos, videos)Analysis of creative intelligence (e.g. keywords, colors, emojis)
  • Ad creative insights (e.g. ad copy, photos, videos)
  • Analysis of creative intelligence (e.g. keywords, colors, emojis)

What our customers are saying

Adriel made it easy for us to track our online ads across multiple platforms. The reporting process is now a lot more straightforward for my account managers, and our clients are in love with their new live dashboard. What a win!
J.Townley, Founder of Paparico
Marketing Agency
+140%
ROI
100%
Satisfied Clients
30h
Hours saved per week
Clicks Overview
Impressions
Impressions are the total number of times any of your webpages or your ads appear in search engine results and are viewed by users.

You can measure ad impressions through Adriel’s marketing dashboard across multiple ad channels, creatives, keywords, and audiences.
Link Clicks
Link clicks are the total number of times the links in your ad copy, call-to-action, or images have been clicked.

These links can lead to destinations within or outside of the platform where you’ve launched your ad, such as your landing page, social media profile, or a blog post. This is also a key metric for SEO.
Click-through rates (CTR)
Click-through rates measure the number of clicks you receive on an advertisement—per the number of impressions.

Generally, high CTRs mean that your ads were successful in attracting the attention of your target audience. High CTRs can also lead to lower advertising costs on advertising platforms like Google Ads. This article lists the average CTRs for all your favorite PPC channels.
Cost Overview
Cost-per-click (CPC)
Cost-per-click (CPC), similar to pay-per-click, is a popular programmatic advertising term where you pay an ad seller a cost every time someone clicks on an ad.

Different social media platforms, search engines, and programmatic publishers set different CPCs. They can range anywhere from $0.4 (Twitter Ads) to $6 (LinkedIn Ads). Get the average CPCs for your industry here.
Cost-per-mile (CPM)
Cost-per-mile (CPM) is the amount you pay for every 1000 impressions that your ad garnered. The CPM on different ad channels depends on a number of factors, such as the target audience, ad format, and the level of competition for ad space.
Cost-per-conversion (CPCV)
Everything comes with a cost, even conversions. Cost-per-conversion, or also known as cost-per-acquisition (CPA) pits the total revenue gained from an ad campaign against the total cost of that campaign.

CPCV is one of the easiest and most effective ways to determine if your ads are working. If your CPCV is too high, it could mean you have the wrong keywords, visuals, target audience, or channel. This is why it’s important to have a PPC reporting tool that lets you see super granular data as well as essential KPIs.
Conversions Overview
Conversions revenue
Revenue is the most rudimentary metric you can track on your report, but it helps you and your clients understand which campaigns or channels are bringing in money and which are draining your wallet. When you have this data, you can devise well-informed strategies in the future.

On Adriel’s PPC dashboard, you can view the total revenue for your ad campaigns across multiple digital channels, from LinkedIn Ads and Bing Ads to Walmart Connect.
Conversion rates (CVR)
Conversion rates (CVR) measure how many people took this desired action out of the total number of website visitors. Discover average CVRs by industry here.

Conversions are easier explained than measured, as they involve multiple circular paths from impressions to clicks to action on different marketing channels. But a PPC reporting dashboard reduces the hassle of having to go into each marketing channel and manually looking at each metric to arrive at conversions data.
Return on Ad Spend (ROAS)
When you pit revenue against ad spend, you get return on ad spend. ROAS measures the amount of revenue you earn for every $1 you spend on advertising. Find out what is regarded as a good ROAS ratio here.

Keeping track of your return on investment can be overwhelming when you have multiple campaigns running across different channels. Delegate the task to a reliable marketing dashboard but opt for one that comes with push notifications so that you don’t have to check back every ten seconds for potential fluctuations.

How do I report Meta Ads? What metrics do I show?

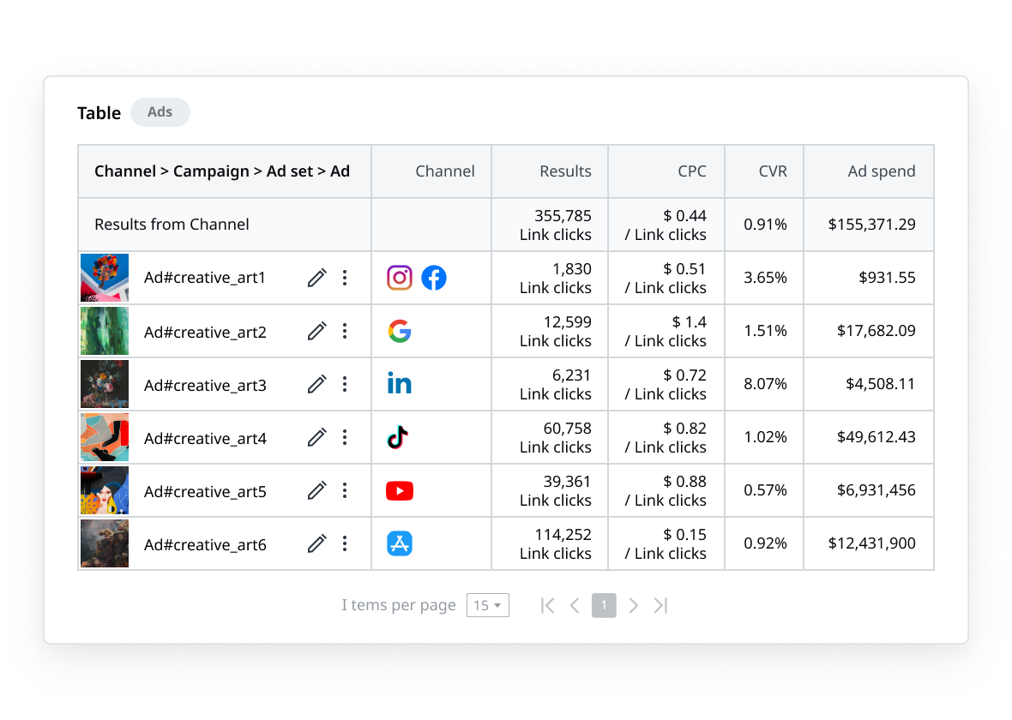
When reporting Meta Ads, you will want to visualize Instagram Ads and Facebook Ads performance side-by-side to understand how each platform is contributing to your digital marketing goals. Here’s how it looks like on Adriel’s report template:

Overview
An overview of key metrics on your Facebook and Instagram accounts.
Facebook
  • Followers
  • Fans
  • Impressions
  • Engagements
  • Reach
  • Profile views
Link Clicks
  • Followers
  • Engagements
  • Impressions
  • Profile views
Charts
A closer look at performance trends. Compare different metrics over a specific time period.
Facebook
  • Facebook Impressions/Profile views
Link Clicks
  • Instagram Impressions/Profile views
Posts
A deep dive of all your Instagram and Facebook posts.
Facebook
  • Facebook posts by
    • Impressions
    • Post engagement
    • Post comments
    • Post like
    • Post shares
Link Clicks
  • Instagram posts by
    • Impressions
    • Post engagement
    • Post comments
    • Post like
    • Post shares
Other metrics you can visualize:
  • Click-through rate (CTR): the ratio of impressions to clicks
  • Cost-per-click (CPC): the price you pay for each click on your Facebook ar Instagram ads
  • Cost-per-mille (CPM): the price you pay for every 1000 impressions
  • Conversion rates: the ratio of ad impressions or clicks that led to purchases or any other
    campaign goal
  • Cost-per-acquisition (CPA): the total cost of landing a new customer through Instagram or
    Facebook Ads

What is cross-platform analytics?

Cross-platform analytics refers to the ability to measure and analyze the performance of marketing campaigns across multiple platforms. This can include channels like:
  • Ad accounts: e.g. Google Ads, Meta Ads, LinkedIn Ads, etc.
  • E-commerce social platforms: e.g. Pinterest, Reddit
  • Programmatic platforms: e.g. Walmart Connect, The Trade Desk
  • Analytics tools: e.g. Google Analytics
  • Mobile analytics tools: e.g. AppsFlyer, Adjust
  • …and other sales and CRM tools
Check out our integration library to find out which platforms you can integrate to Adriel.
Cross-platform analytics helps agency owners and marketers identify areas where they need to make adjustments to optimize their ad spend. For instance, they can look at conversion and revenue figures and decide how to reallocate their budget across different marketing platforms.

What factors do we need to consider while making a digital dashboard?

To build an impactful cross-platform dashboard, you should consider:
The number of integrations
Most dashboard software in the market allows you to connect with anywhere from 60 to 600+ advertising and analytics platforms. The more connections, the better. Adriel supports integrations with 600+ channels and if there’s one that we don’t support natively, we can custom-make it for you.
Ease of use
It’s not just about the number of connections but also how easy it is to connect to these data sources.On Adriel, you can simply choose the platform you want to connect to from a drop-down list, and drag and drop widgets to start building your dashboards.
Real-time data
In a world where data is evolving every second, you need a dashboard that streams data as it comes in real-time so you can always see the latest campaign performance and take action in a timely manner.
Visualize ad creative data
Most dashboard software can show you all the main KPIs at a glance. But what if you want to dive deep into the details of your marketing campaigns? Adriel shows you granular data down to the ad level and allows you to report back on headlines, CTAs, and ad copies that led to higher conversion rates.
Alert system
Look for a dashboard software that alerts you whenever campaign metrics go above or below a certain KPI. With Adriel’s cross-channel alarm system, you can take advantage of opportunities and fix issues immediately.
White label reports
When it comes to client reporting, it’s very time-consuming to manually build complex dashboards in Google Data Studio or beautify your reports on PowerPoint. With Adriel, you can generate PDF reports with your brand visuals and client logos and colors within minutes.

How do I create an executive dashboard?

Creating an executive reporting dashboard is as easy as 1-2-3 with Adriel. You just need to choose your data-source from a drop-down list and start using our ready-made templates or customize your own with interactive widgets and graphs. No coding and technical knowledge required.

1
Create an account
Book a Demo to get started. After your demo, we'll send you a link to sign up to Adriel for 14 days free. We'll also help you choose a pricing plan that suits your needs.
2
Connect data sources
Simply choose from a drop-down list to import dimensions and metrics from your ad accounts, analytics tools, and mobile measurement partners. See this page for a full list our integrations.
3
Visualize your data
Use our ready-made templates to instantly see all your KPIs in minutes. Or, start from a blank page and choose your data visualization widgets and graph types.

A Comprehensive All-in-One Performance Dashboard to Monitor All Your Paid Media KPIs

Easily Track Paid Campaign Results in a Single Executive Dashboard

Integrate all your paid ad channels’ results into one executive dashboard.
Curious to know how your Meta, Google, or TikTok Ads are performing? Connect all of these platforms to Adriel, and in less than 5 minutes, show all of your paid campaign results in one unified dashboard. See our integrations page for more information.

Create an Insightful Executive Dashboard Using Our Pre-made Templates

You can start from a blank page to create an executive dashboard, but what if you don’t have time?
Our extensive pre-made executive dashboard library has everything you might need. Try Adriel, and you’ll have more time to research ways to increase conversion or optimize your landing pages.

White-Labeling & Customization In Our Executive Reporting Tool

Our software was expertly designed with powerful functions for marketers. But everything can be customized. Adriel’s flexibility allows you to change all aspects of the dashboard design and appearance. Impress your clients or executives with a professional executive dashboard report for an expert brand image.

Other Dashboard Examples

PPC Dashboard
Have pay-per-click campaigns on different channels? A PPC dashboard aggregates and displays all your key insights in one place so you can optimize for higher ROAS.
Social Media Dashboard
Paid social campaigns are critical for brand awareness and conversions. See marketing dashboard examples to track campaign performance in real-time.
Manager Dashboard
Keep on top of all the critical information the management needs to know in order to make decisions with our ready-to-go manager dashboards.

Why Leading Advertisers Choose Adriel

Eliminate manual reporting
Spend more time acting for impact and less time on repetitive tasks
Foolproof your data
Say goodbye to data translation risks with automated data transfers and harmonization
Get real-time alerts
Automatically track KPIs and insure all your campaigns against unforeseeable errors
Drive better performance
Access a full suite of creative intelligence tools designed to help you maximize performance
White label your work
Generate beautifully branded reports your clients will love in minutes
Offer better services
Get more time to do what you love and build more trustworthy relationships

What our customers are saying:

Revenue
+170%
Management Cost
-20%
Hours saved per week
45h
I was always asking for reports from my teams but by the time I got them it was too late to capitalize on some important insights, which hindered our growth. Now I just sign in to Adriel and see everything for myself as it happens.
J.Riley, CEO of Edge
Digital Agency
ROI
+140%
Satisfied Clients
100%
Hours saved per week
30h
Adriel made it easy for us to track our online ads across multiple platforms. The reporting process is now a lot more straightforward for my account managers, and our clients are in love with their new live dashboards. What a win!
P. Townley Jones, Founder of Paparico
Marketing Agency

FAQs

All your questions answered. And if you can’t find it here, chat to our friendly team.
What are the benefits of an executive dashboard?

If you’re a marketing agency looking to scale up, a management dashboard can be the ultimate project management tool that you need to monitor and optimize all your clients’ ad campaigns in one place.Here are three main benefits of using one:

1. Contextualization: In the digital marketing landscape, there’s simply too much data for even the brightest analytics whiz to be able to connect the dots between disparate data points in their raw state.

But with a business intelligence dashboard, you’ll be able to see this data in context in digestible widgets and graphs.

2. Automation: Dashboards eliminate manual workflows and spreadsheets that would otherwise eat up a great deal of time and prevent your team members from working on needle-moving tasks.

3. Faster reporting: Self-service manager dashboard software like Adriel offers a white-labeled reporting feature that allows both business users and end-users to put together reports packed with real-time insights and intuitive data displays.

What makes a “good” executive dashboard?

An effective business intelligence tool is both a strategic dashboard and an operational dashboard at the same time.Top-level executives should be able to see a high-level view of marketing KPIs right off the bat, but also be able to drill down to granular data and uncover which channels or advertisements are driving sales or engagement.

Having the option to invite different members of the executive team with different access rights and views would also help greatly. For instance, a CFO should have access to a particular set of performance metrics, while a CMO should have access to another.

In terms of user experience, a simple, clear, and easy-to-read user interface would lead to better analysis and informed discussions across the executive team.

But the work of dashboard software doesn’t end at visualization. You should be able to export this data into a PDF or a CSV report and share it with different stakeholders through unique links.

This is especially helpful if you’re a marketing agency that needs to report to your clients regularly so they can stay informed on the performance of your initiatives.

What is the difference between a dashboard and a report?

Here are the main differences between the two:

 • Dashboards are interactive, reports are static.

On an interactive dashboard, you can see performance changes in real-time, experiment with widgets and graph types, and adjust the metrics and trends you want to visualize. Once you’re satisfied with your dashboard, you can then download the data as a PDF or CSV report, but they will no longer be customizable.

 • Dashboards are comprehensive, reports are focused.

Dashboards provide a wide range of information to showcase an overview of your marketing performance. In contrast, reports zoom in on a specific narrative depending on who it’s for. For instance, a report for a CFO would focus on sales performance, while one for a CMO would focus on an in-depth analysis of channels and creatives.

 • Dashboards are for internal teams, reports are for executives and clients.

Because dashboards are interactive and comprehensive, they’re usually for internal teams to keep track of insights and make day-to-day decisions. When the time comes for monthly or quarterly reports, teams put together reports based on the dashboard data for executives and other external stakeholders (e.g. clients).

On Adriel’s dashboard, you can get the best of both worlds. Create different views for different stakeholders on an interactive dashboard and generate white-labeled reports in just a few clicks.

Take control of your marketing data today

Thank you! Your submission has been received!
Oops! Something went wrong while submitting the form.
Don't Go!
Book a 1:1 Demo Instead.
We’ll help you optimize your Ad Operations processes and save thousands of dollars every month on ad spend and reporting.
Thank you!
You will be redirected shortly.
Oops! Something went wrong while submitting the form.