Ditch spreadsheets and speed up SEO reporting for your marketing agency or brand. Turn Google Search Console data into actionable insights with our GSC dashboard.


Similar to a SEO dashboard, a Google Search Console dashboard shows all the key metrics for organic traffic and search analytics for both branded and non-branded search terms. It pulls Google Search Console data through APIs and turns it into actionable insights.
Measure organic search performance against goals, and track metrics on a daily basis. Impress clients or managers with attractive visual reports that are easier to understand than GSC’s native reports. Collaborate on live dashboards in one-click with team members.
Creating a GSC dashboard is as easy as 1-2-3 with Adriel. You just need to choose “Google Search Console” as your data-source from a drop-down list and start using our ready-made templates or customize your own with interactive widgets and graphs. No coding and technical knowledge required.

Sign up for Adriel with your email after your demo.
You can then select a pricing plan that suits your needs.

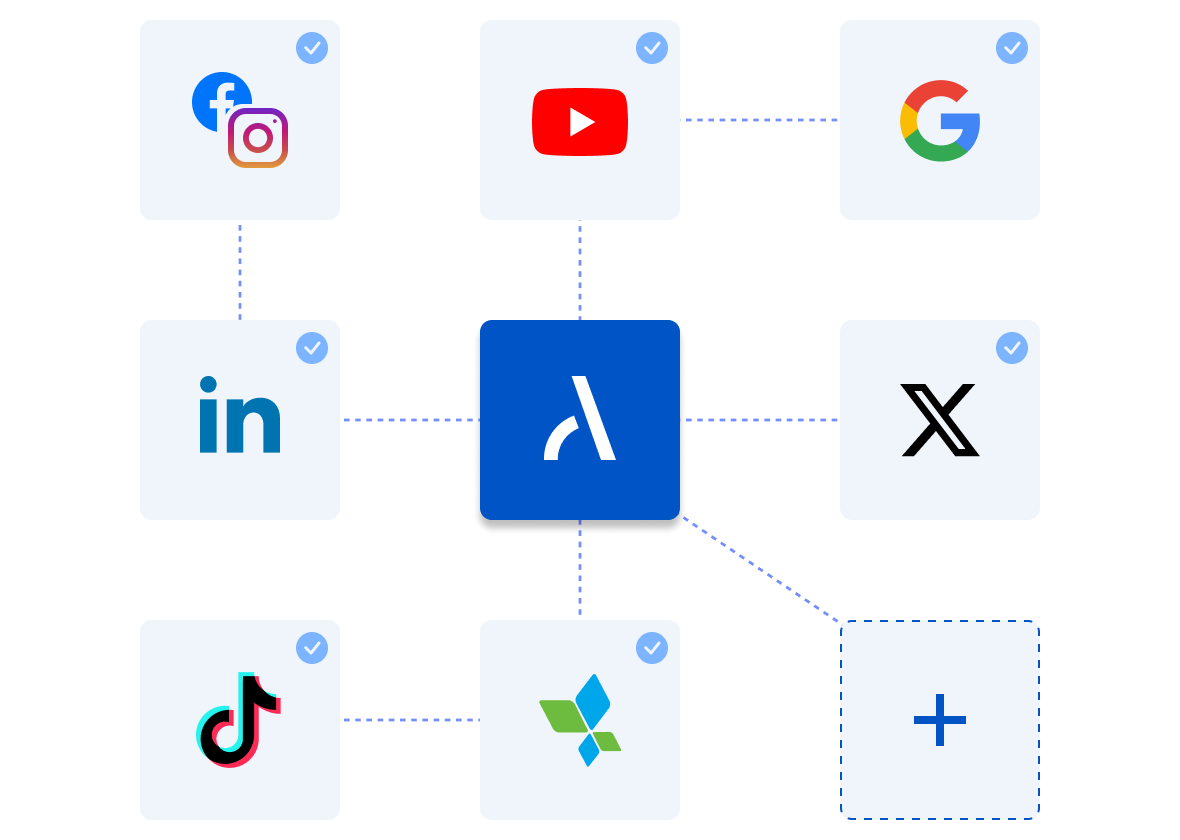
Simply choose from a drop-down list to import dimensions and metrics from your ad accounts, analytics tools, and mobile measurement partners.
Adriel supports integrations with up to 650+ data sources, including popular channels like Meta and Facebook Ads, Google Ads, and LinkedIn Ads.
And if you don’t see an integration that we support natively, we can create custom integrations just for you.

Use our ready-made templates to instantly see all your KPIs in minutes. Or, start from a blank page and choose your data visualization widgets and graph types.

If you’re a marketing agency, you want to be able to present different sets of information to different stakeholders.
Set up different views for each role or client on Adriel with different access restrictions in just a few clicks.
Need Google Analytics reports to share with clients or the C-suite team?
Determine your brand visuals, colors, and client logos, and download reports as PDFs or CSVs or get live links in minutes.
A GSC dashboard monitors your brand’s or client’s website's SEO performance.
It’s a visual snapshot of key Google Search Console metrics that help you understand how well your site is doing in Google Search, and what changes you should make to improve and optimize it further.
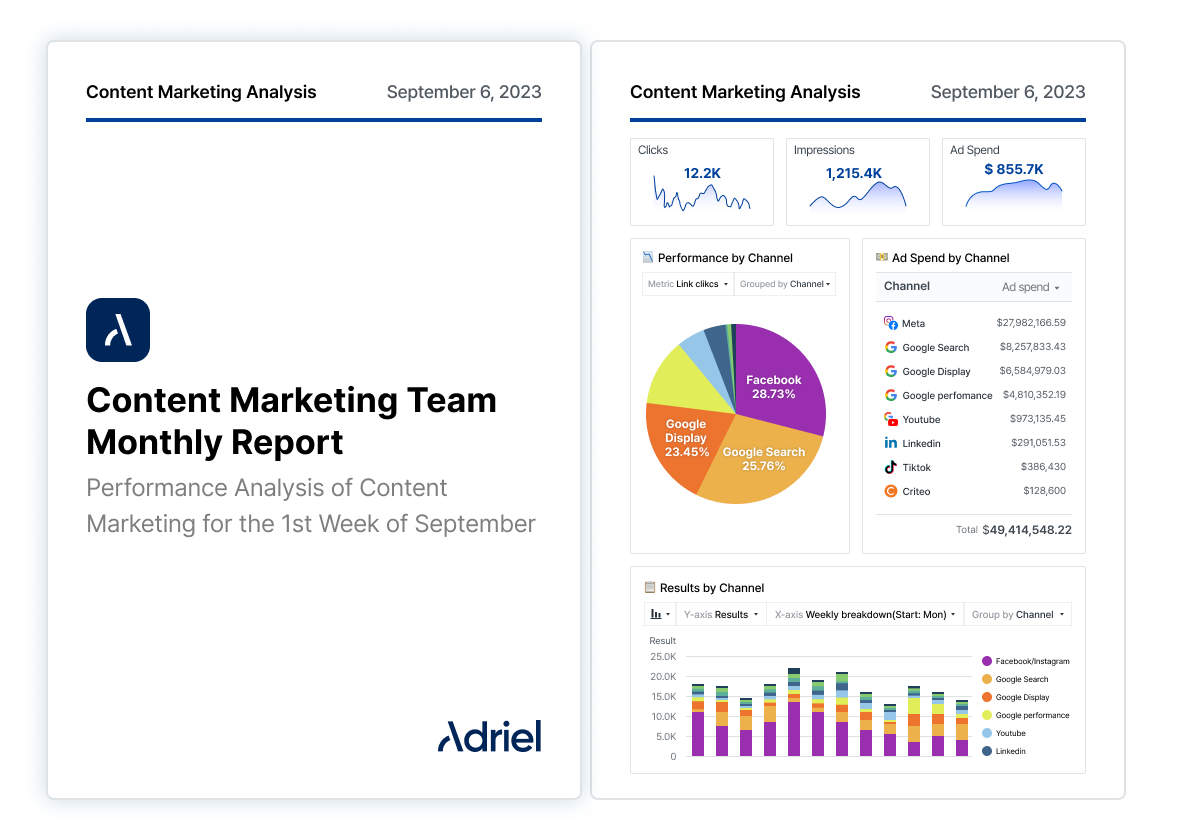
Adriel’s GSC dashboard is divided into four sections:
A screenshot of your search performance and goals. Key SEO metrics include:


A detailed breakdown of the number of impressions and link clicks by country, and performance trends over time.
A detailed breakdown of the number of impressions
and link clicks by device type, and performance trends over time.


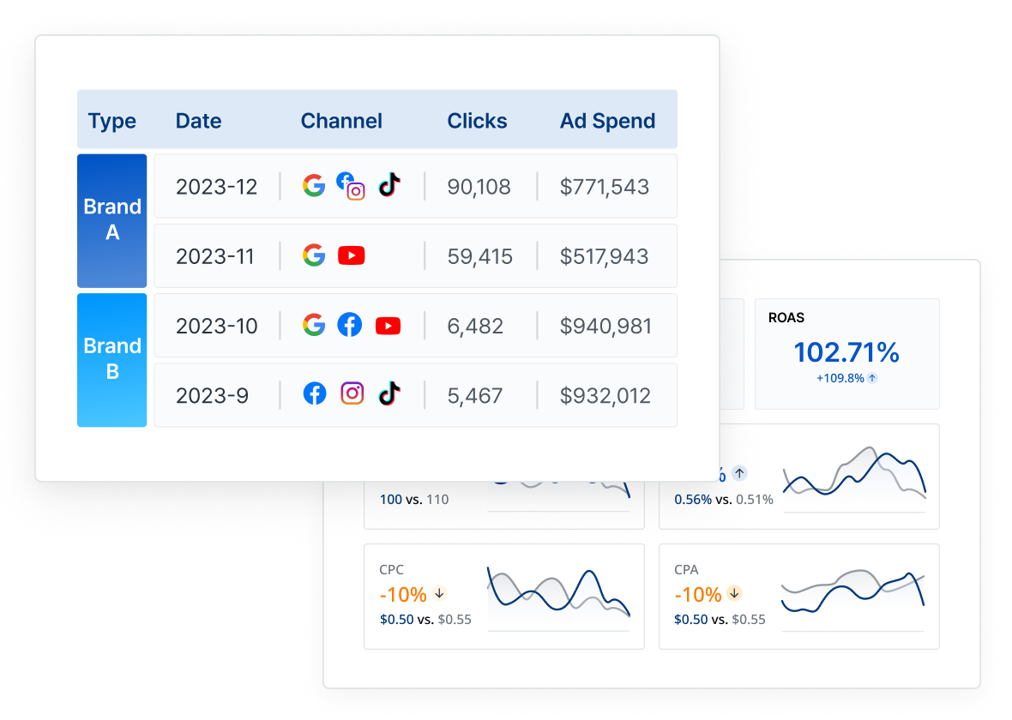
A detailed analysis of search performance data. Key metrics include:


When reporting Meta Ads, you will want to visualize Instagram Ads and Facebook Ads performance side-by-side to understand how each platform is contributing to your digital marketing goals. Here’s how it looks like on Adriel’s report template:


Integrate all your paid ad channels’ results into one marketing reporting dashboard. Curious to know how your Meta, Google, or TikTok Ads are performing? Connect all of these platforms to Adriel, and in less than 5 minutes, show all of your paid campaign results in one unified dashboard. See our integrations page for more information.
You can start from a blank page to create a marketing reporting dashboard, but what if you don’t have time? Our extensive pre-made marketing reporting dashboard library has everything you might need. Try Adriel, and you’ll have more time to research ways to increase conversion or optimize your landing pages.
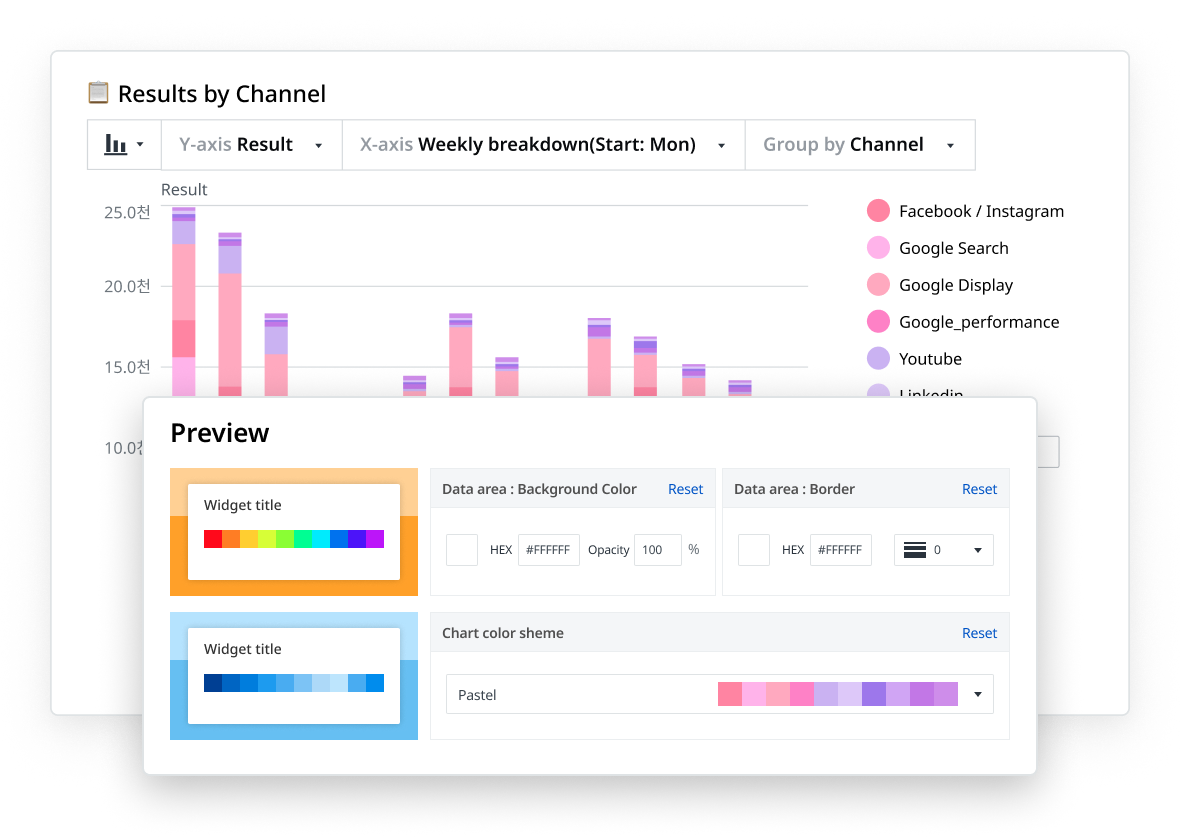
Our software was expertly designed with powerful functions for marketers. But everything can be customized. Adriel’s flexibility allows you to change all aspects of the dashboard design and appearance. Impress your clients or executives with a professional marketing reporting dashboard report for an expert brand image.


.png)

Google Search Console is an all-in-one toolkit for monitoring and improving your website's SEO performance. It shares insights directly from Google about how a website is performing in Google search results. Here's what GSC is used for in SEO:
Google Search Console and Google Analytics are both important SEO tools for brand marketers and agencies, but they serve different purposes and provide different types of data:
Both are often used together for a holistic view of a website's overall health and performance.
The GSC dashboard comes with a 14-day full-service free trial. No payment information is required.
If you are happy with the trial and want to continue, you can check out the pricing page here. Pricing is tailored to work at any scale.
Get started today!


