See how your Google Ads campaigns are performing at a glance. Find out which campaigns, keywords, and ads are driving the most conversions and why with our pre-built Google Ads Dashboard.


Adriel’s Google Ads dashboard is a custom dashboard tool that provides a total overview of all your Google ad campaigns at a glance. It shows your KPIs such as clicks, impressions, click-through rate (CTR), cost-per-click (CPC), and Conversions in visual charts and graphs.
On Adriel, you can not just monitor and manage your Google Ads, but also edit all your campaigns, ad groups, ads, and keywords directly from the main workspace. Adjust bids, turn off campaigns, and take action immediately with real-time alerts if and when your KPIs take a dip. See insights down to the creative level – words, images, and colors – and drive ROI.
Creating a Google Ads dashboard is as easy as 1-2-3 with Adriel. You just need to choose your Google Ads Account as a data-source from our drop-down list and start using our ready-made templates or customize your own with interactive widgets and graphs.
No coding and technical knowledge required.

Sign up for Adriel with your email after your demo.
You can then select a pricing plan that suits your needs.

Simply choose from a drop-down list to import dimensions and metrics from your ad accounts, analytics tools, and mobile measurement partners.
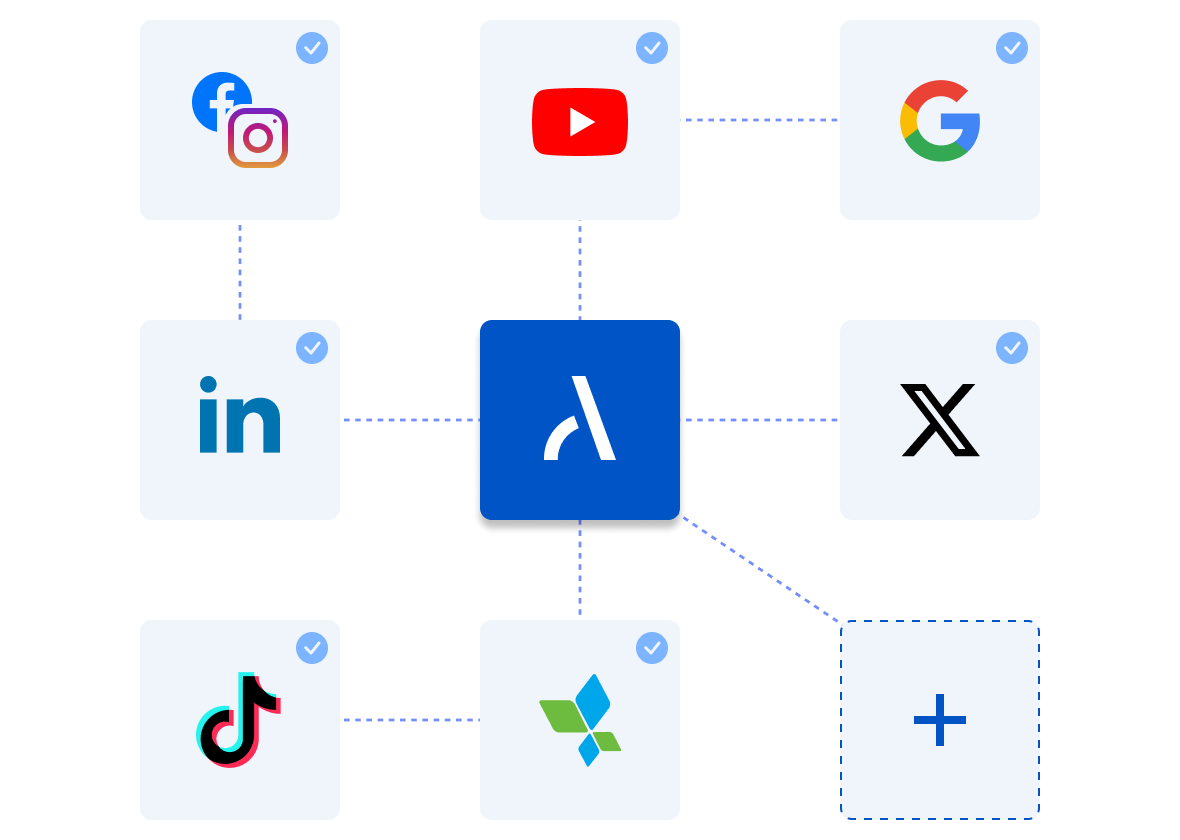
Adriel supports integrations with up to 650+ data sources, including social media channels like:
And if you don’t see an integration that we support natively, we can create custom integrations just for you.

Use our ready-made templates to instantly see all your KPIs in minutes.
Or, start from a blank page and choose your data visualization widgets and graph types.

Whether you are working at a marketing agency or a brand, set up different views for each role or client on Adriel with different access restrictions in just a few clicks.
Need Google Analytics reports to share with clients or the C-suite team?
Determine your brand visuals, colors, and client logos, and download reports as PDFs or CSVs or get live links in minutes.
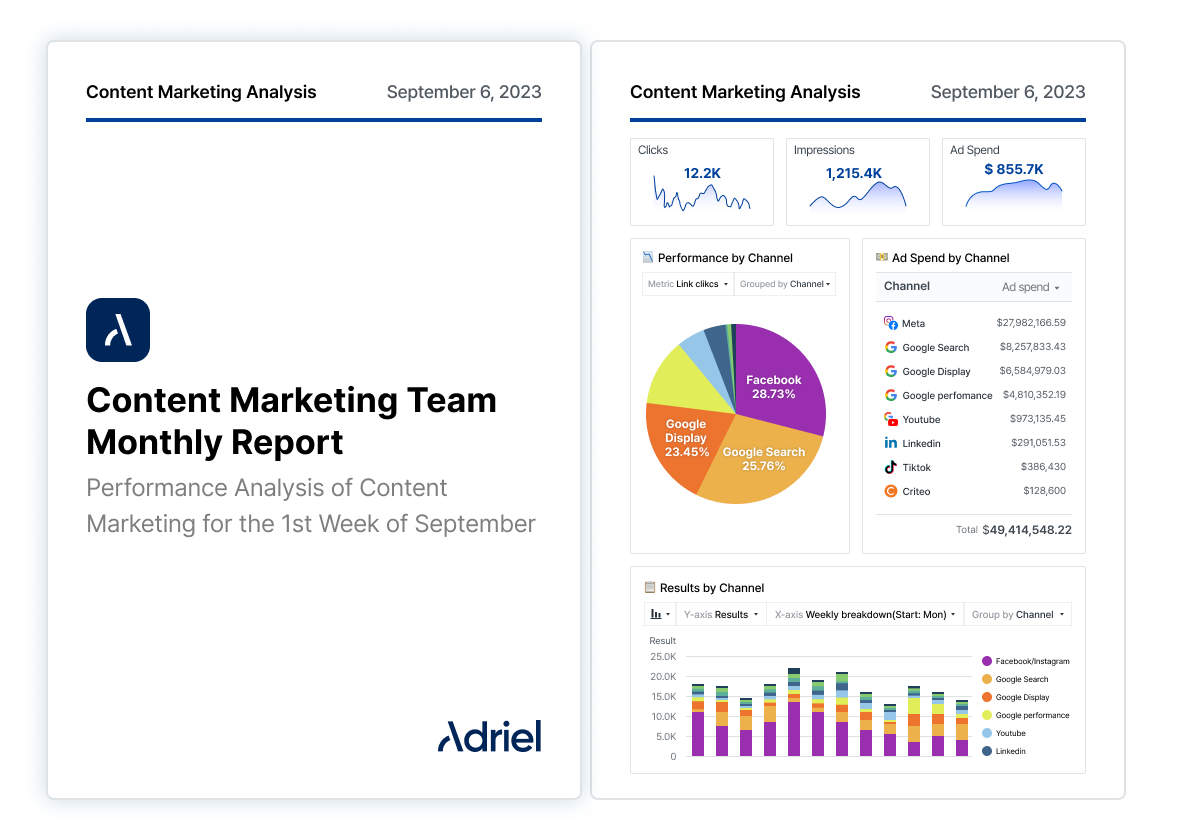
A Google Ads dashboard shows a variety of key performance indicators (KPIs) and metrics
that help you understand how your Google Ads are performing.
Here are some of the main metrics on a Google Ads dashboard:


Impressions are the total number of times any of your ads appear in search engine results and are viewed by users. Determine which campaigns generate the highest impressions and dissect the strategy behind them.
Link clicks are the total number of times the links in your ad copy, call-to-action, or images have been clicked. See how many people are visiting your website or social media with a marketing data dashboard.
Uncover which marketing investments are paying off the most. Get actionable insights on which ad channels to focus on in the future.
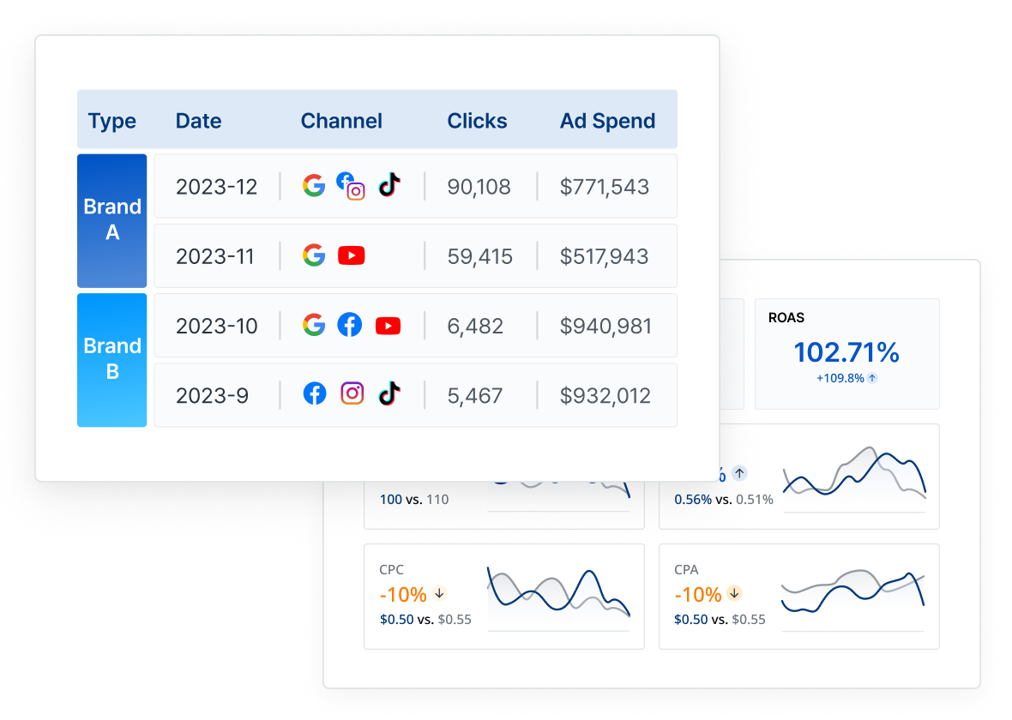
ROAS measures the amount of revenue you earn for every $1 you spend on advertising. Find out what is regarded as a good ROAS ratio here.

Conversions occur further down the marketing funnel after a person visits your website and takes a desired action, such as purchasing a product, downloading a whitepaper, or signing up for a newsletter. Discover the conversions generated from marketing activities within minutes on a campaign dashboard.
Pit conversions against total ad interactions to get conversion rates. Compare your conversion rates against any other metric, such as ad spend, to better understand your marketing performance.
See how many people are interested inyour ads and want to learn more about you with dashboard software. Find out which ad creatives generated the highest clicks and why. This article lists the average CTRs for all your favorite PPC channels.
Monitor your advertising cost in real-time by keeping track of cost-per-click closely. Get alerts on your dashboard or in your email inbox when costs go above set budgets.


When reporting Meta Ads, you will want to visualize Instagram Ads and Facebook Ads performance side-by-side to understand how each platform is contributing to your digital marketing goals. Here’s how it looks like on Adriel’s report template:


Integrate all your paid ad channels’ results into one marketing reporting dashboard. Curious to know how your Meta, Google, or TikTok Ads are performing? Connect all of these platforms to Adriel, and in less than 5 minutes, show all of your paid campaign results in one unified dashboard. See our integrations page for more information.
You can start from a blank page to create a marketing reporting dashboard, but what if you don’t have time? Our extensive pre-made marketing reporting dashboard library has everything you might need. Try Adriel, and you’ll have more time to research ways to increase conversion or optimize your landing pages.
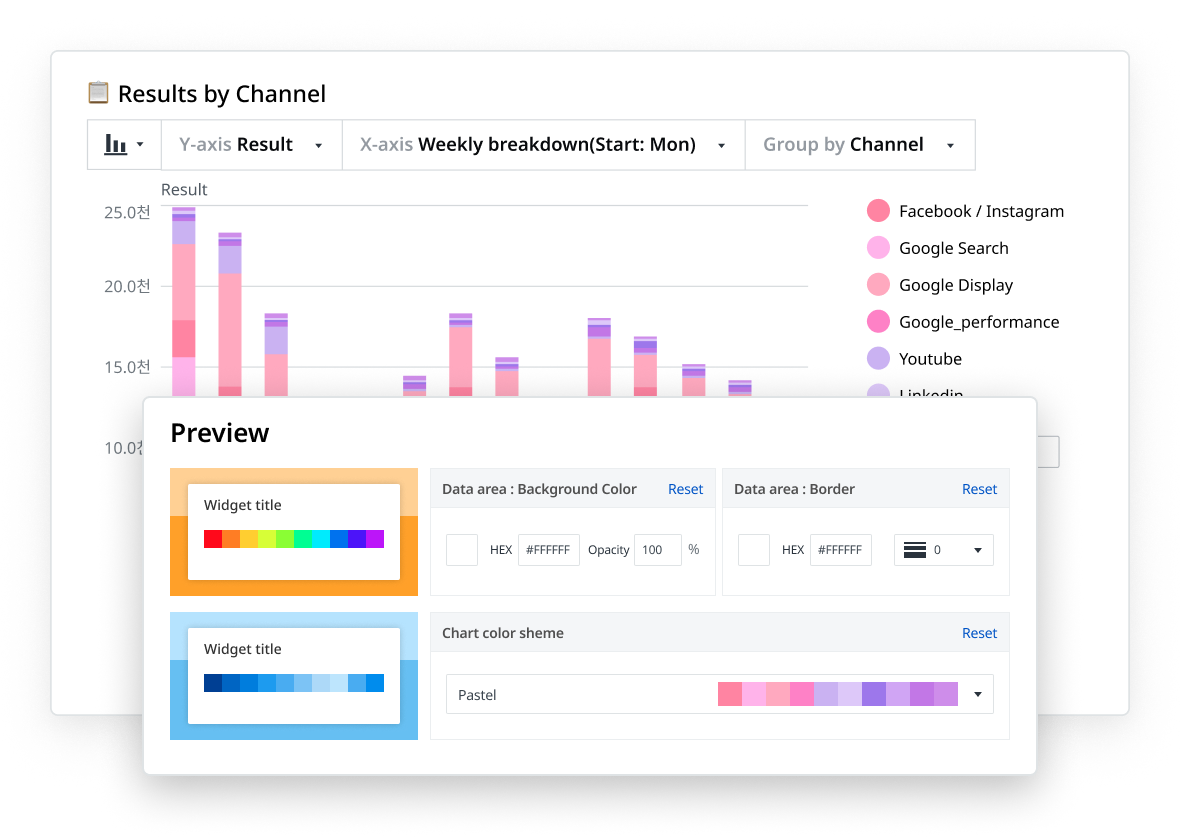
Our software was expertly designed with powerful functions for marketers. But everything can be customized. Adriel’s flexibility allows you to change all aspects of the dashboard design and appearance. Impress your clients or executives with a professional marketing reporting dashboard report for an expert brand image.


.png)

Google Ads is a digital advertising solution by Google. It lets businesses display ads on Google's search engine results pages and its network of partner websites.
Advertisers bid on keywords that are relevant to their business and their ads are displayed when users search for these keywords on Google. Google Ads operates on a pay-per-click model, meaning advertisers only pay when a user clicks on their ad.
You can easily export your Google Ads data in Excel or PDF reports in customized formats on Adriel’s Google Ads dashboard. Users can also create a unique shareable URL that links back to a live dashboard that updates insights in real-time.
Simply select the desired time range for your report, filter your data by campaign titles, status, ID channels, or ad account if you want to narrow your results, and click “Download”. Or click on the “Share” button for URLs.
You can see what ads are running on Google Ads on the table titled “Overall detailed table” at the bottom of the Adriel dashboard.
It shows the different keywords for which the ads are running – followed by details like budget, ad spend and other ads performance metrics like CPC, CVR, ROAS, etc.


