Ditch Excel and Google Sheets. Track your organic social KPIs in real-time on a live dashboard. Save time and make better decisions with our ready-made organic social media dashboard template.


An organic social media dashboard is a centralized platform that tracks key performance indicators (KPIs) for non-paid social media activities. It provides real-time insights into performance metrics like engagement, subscribers, and reach across various social media platforms.
For marketers, this dashboard is crucial for understanding audience behavior, optimizing content strategies, and proving ROI, all without the skew of paid promotions.
Creating a social media dashboard is as easy as 1-2-3 with Adriel. You just need to choose the social media accounts as data-sources from a drop-down list and start using our ready-made templates or customize your own with interactive widgets and graphs. No coding and technical knowledge required.

Sign up for Adriel with your email after your demo.
You can then select a pricing plan that suits your needs.

Adriel supports integrations with up to 650+ data sources, including social media channels, eCommerce tools, ad platforms, and analytics tools, like:
And if you don’t see an integration that we support natively, we can create custom integrations just for you.

Use our ready-made templates to instantly see all your KPIs in minutes.
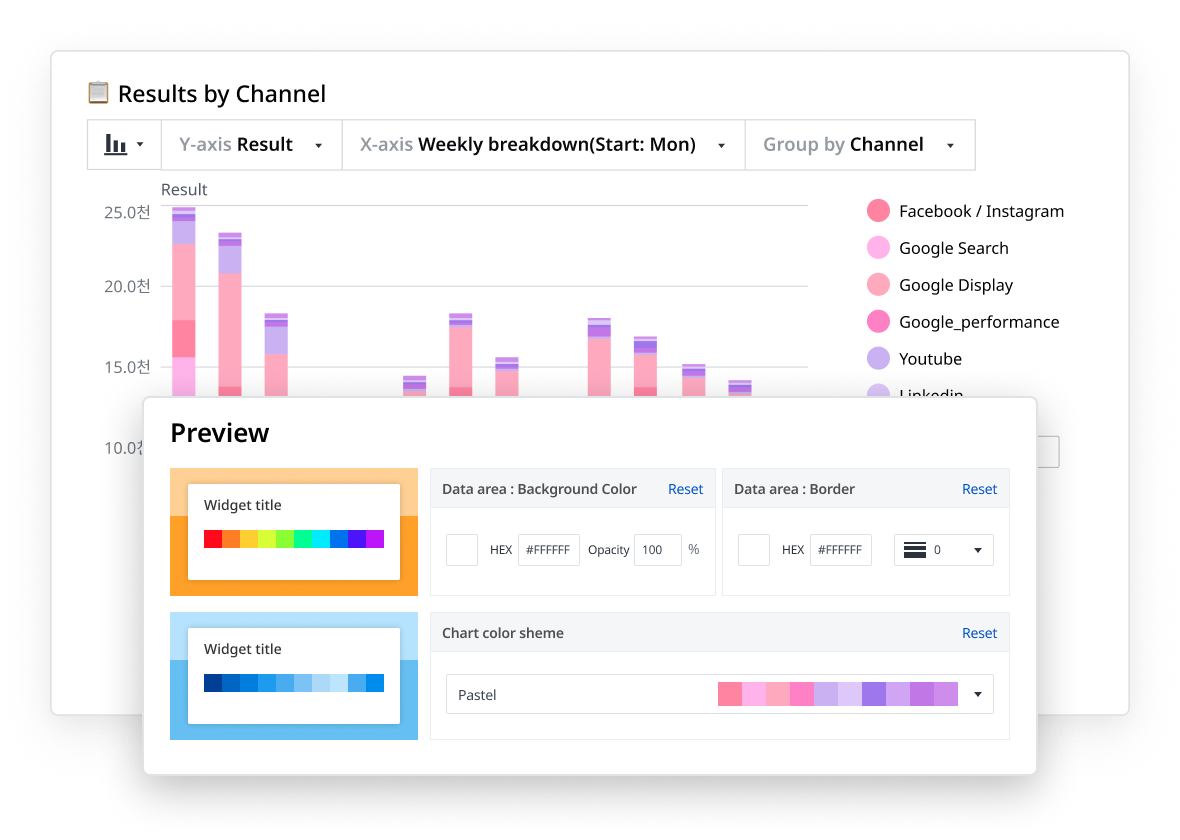
Or, start from a blank page and choose your data visualization widgets and graph types.

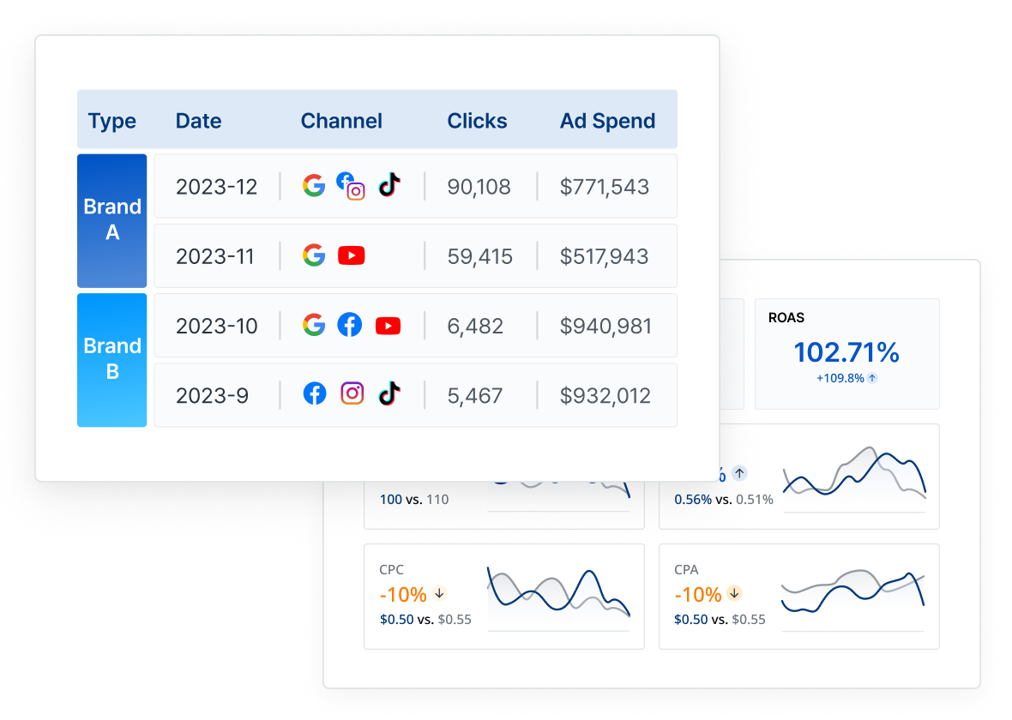
If you’re a marketing agency, you want to be able to present different sets of information to different stakeholders.
Set up different views for each role or client on Adriel with different access restrictions in just a few clicks.
Need paid media reports to share with clients or the C-suite team? Determine your brand or client visuals, colors, and logos, and download reports as PDFs or CSVs or get live links in minutes.
An organic social media analytics dashboard should show key performance indicators (KPIs) related to your unpaid social media marketing across channels like Twitter, Linkedin, Instagram, Meta, and YouTube.
Some examples of social media metrics include:


Impressions measure the total number of times your content has been displayed on someone's screen, regardless of clicks or engagement. Analyzing impressions data can help you identify optimal posting times and content types for greater visibility and engagement.
The unique number of users who have seen your content. Unlike impressions, which count multiple views by the same user, reach measures the actual spread of your message. A high reach means a lot of people are seeing your posts, which is a good sign that you're getting your or your client’s brand out there.
Engagement rate measures the level of interaction your content receives, such as likes, comments, and shares, relative to your total follower count. It shows whether your content is connecting with your audience, going beyond visibility to indicate actual interest and interaction.
CTR measures the percentage of viewers who clicked on a link, image, or video you shared, relative to the total number of impressions. A high CTR means that people are not just seeing your content, but they're also clicking on it, indicating a high quality and appeal of your messaging.

Follower growth rate monitors the speed at which your follower count is increasing over a specific time period. It helps you understand the scalability of your social media efforts.


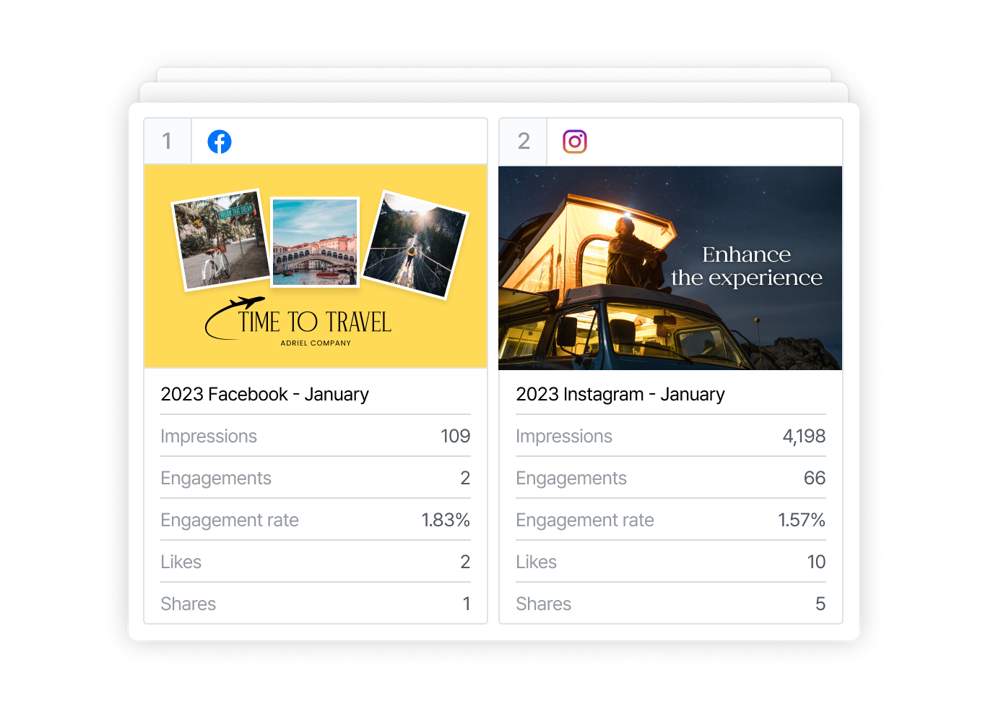
When reporting Meta Ads, you will want to visualize Instagram Ads and Facebook Ads performance side-by-side to understand how each platform is contributing to your digital marketing goals. Here’s how it looks like on Adriel’s report template:


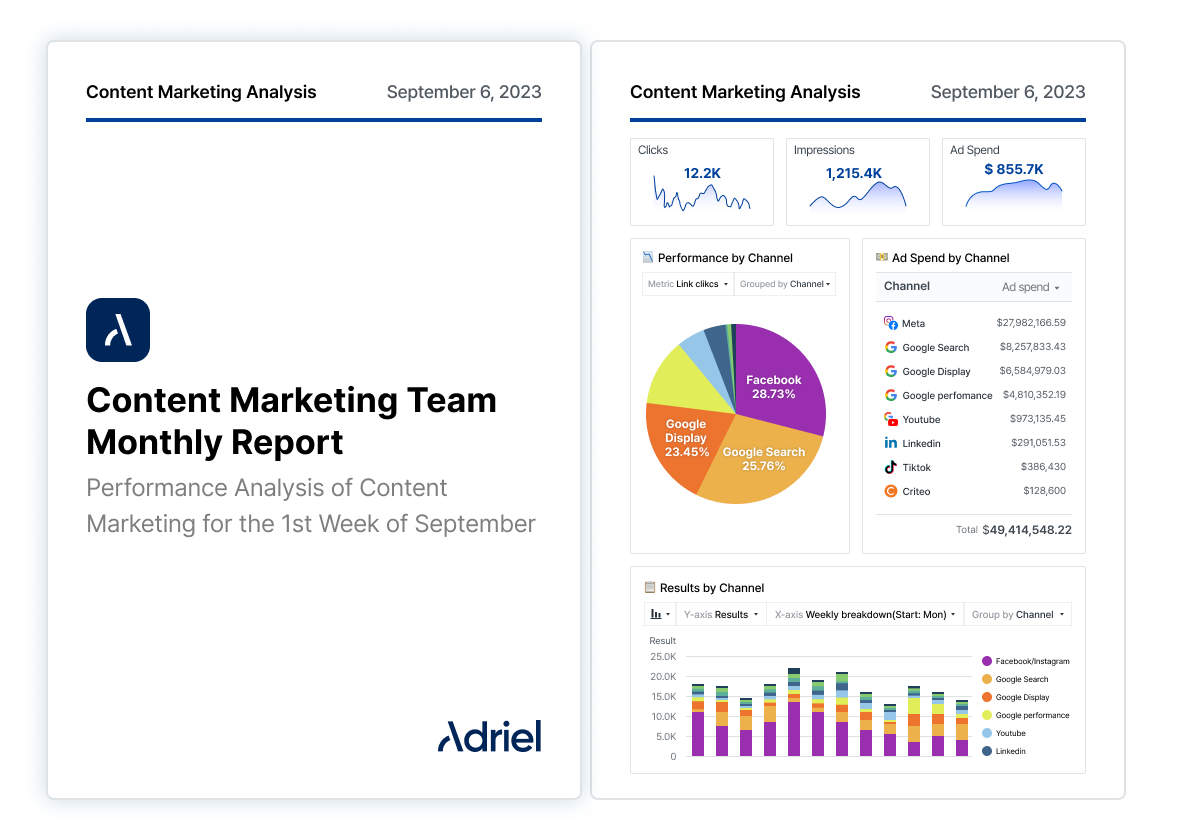
Integrate all your paid ad channels’ results into one marketing reporting dashboard. Curious to know how your Meta, Google, or TikTok Ads are performing? Connect all of these platforms to Adriel, and in less than 5 minutes, show all of your paid campaign results in one unified dashboard. See our integrations page for more information.

You can start from a blank page to create an organic marketing reporting dashboard, but what if you don’t have time? Our extensive pre-made marketing reporting dashboard library has everything you might need. Try Adriel, and you’ll have more time to research ways to increase conversion or optimize your landing pages.
Our software was expertly designed with powerful functions for marketers. But everything can be customized. Adriel’s flexibility allows you to change all aspects of the dashboard design and appearance. Impress your clients or executives with a professional marketing reporting dashboard report for an expert brand image.


.png)

An organic social media dashboard helps you track and analyze your brand’s unpaid social media activities across various platforms.
It consolidates data like engagement rates, follower growth, and content performance into one place.
It's essential for businesses and marketers for several reasons:
In essence, a social media dashboard is a vital tool for optimizing strategies, staying agile, and driving tangible results for your social media page.
You can create an organic social media dashboard in two ways:
This method is faster and easier. All you need to do is connect your social media accounts and all the important data like clicks and impressions will automatically flow onto our dashboard. No coding or setting up required.
This takes longer but is suitable if you want more control:
The metrics for an organic social media dashboard can vary depending on the specific social media channel. Here are some examples for popular platforms:
When it comes to the best social media dashboard, Adriel takes the crown. Here’s why: