Refer a partner and get paid! Earn 20% of all qualifying subscriptions referred to our team 👉
Learn More

Advertising Cost Analysis Dashboard Template

Get a comprehensive picture of how much you’re spending on all your advertising and marketing channels. Plan your marketing budget based on real-time data and ad spend trends.

Track your most important KPIs for all your ad campaigns in one place

Explore ready-made marketing reporting dashboard templates:
Performance Dashboard
Optimize for better financial performance on your PPC campaigns with a powerful dashboard tool. Find out which ad campaigns are working and which are underperforming and allocate budget accordingly.
Connectors used:
KPI Dashboard
Need an all-in-one tool to track all your important KPIs in real-time? A marketing dashboard visualizes both high-level KPIs and granular data. Find out how it works with ready-made templates.
Connectors used:
eCommerce Dashboard
If you are an eCommerce retailer running ad campaigns, you need an automated dashboard to monitor sales performance. Connect easily to our eCommerce dashboard for key revenue and conversion metrics.
Connectors used:

Need a custom reporting or dashboard template?
We got you covered.

Get your custom template within 48 hours

Have a report you’d like us to replicate, or need some extra assistance? Get in touch with us and we’ll build a template within 48 hours to help you evaluate Adriel for your business’ specific goals.
Get a Demo

What is an advertising cost analysis dashboard?

An advertising cost analysis dashboard is an automated tool for tracking ad spend and ad performance on all your PPC campaigns. It shows you how much you’re spending on ads, breaks down spending by platform, and tracks the return on investment from these ads.

Instead of tracking spending on Excel spreadsheets and Google sheets, Adriel’s automated dashboard is a simple and more intuitive way to understand how your ad budget is spread across multiple channels.

How would you put together an advertising cost dashboard?

Creating a cost dashboard is as easy as 1-2-3 with Adriel. Just connect to your ad accounts from a drop-down list and your cost data will automatically flow into the dashboard in minutes. No coding and technical knowledge required.

Create an account

Sign up for Adriel with your email after your demo.


You can then select a pricing plan that suits your needs.

Connect your accounts

Simply choose from a drop-down list to import dimensions and metrics from your ad accounts, analytics tools, and mobile measurement partners.

Adriel supports integrations with up to 650+ data sources, including ad platforms, social media channels, analytics tools, and eCommerce platforms like:

  • Meta Ads
  • Instagram
  • Google Analytics
  • Shopify
  • MailChimp

And if you don’t see an integration that we support natively, we can create custom integrations just for you.

Visualize your data

Use our ready-made templates to instantly see all your KPIs in minutes.
Or, start from a blank page and choose your data visualization widgets and graph types.

Create different views for different stakeholders

If you’re a marketing agency, you want to be able to present different sets of information to different stakeholders.

Set up different views for each role or client on Adriel with different access restrictions in just a few clicks.

Download and share white-labeled reports

Need paid media reports to share with clients or the C-suite team?
Determine your brand visuals, colors, and client logos, and download reports as PDFs or CSVs or get live links in minutes.

How should you structure your marketing cost analysis dashboard?

A cost and marketing analytics dashboard breaks down spending on all your advertising and marketing campaigns on different marketing channels.

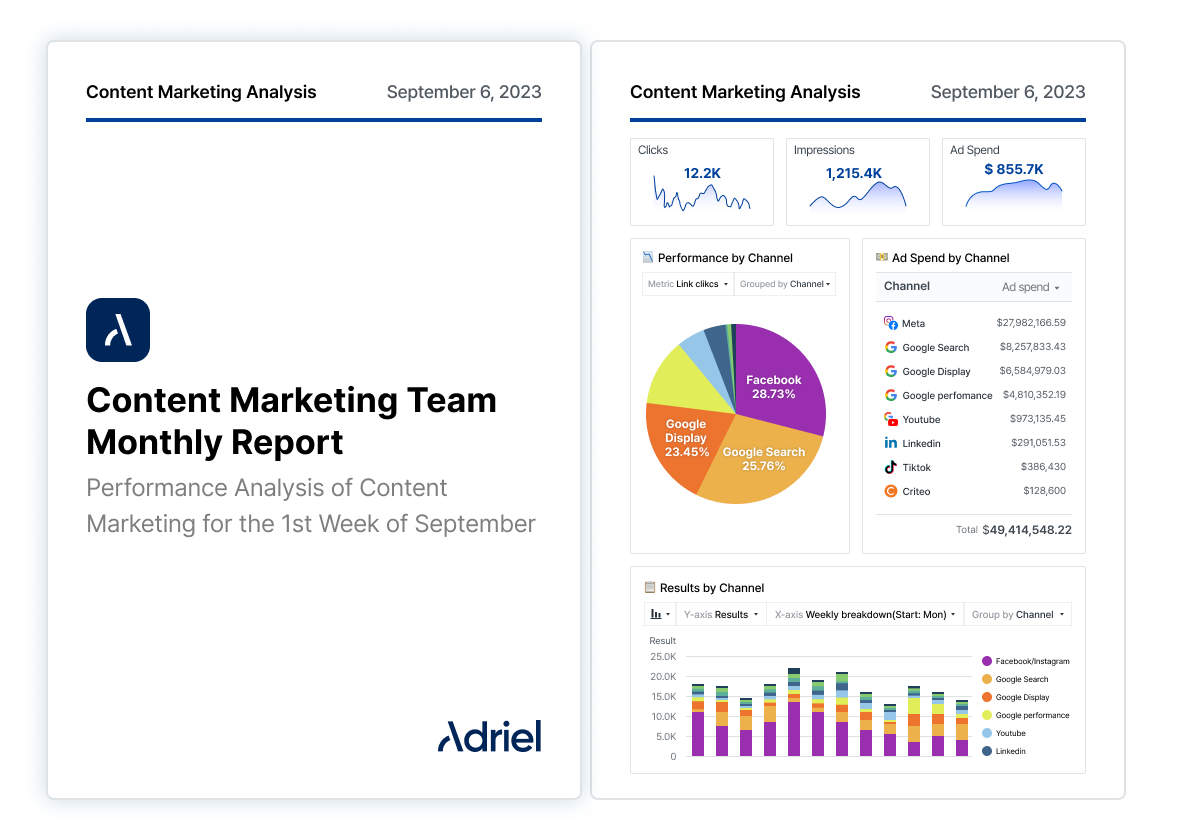
Here’s how we structured our cost analysis dashboard for three media channels: Meta, Google, YouTube, and LinkedIn:

Total ad spend

Total ad spend is the total amount a company spends on various digital ad channels like Meta Ads, Google Ads, Facebook Ads, and others.

It helps track where the advertising budget is being used and measures the investment against the outcomes.

Ad spend by channel

Ad spend by channel shows how much you’re spending on each advertising channel.

This helps you understand which channels are consuming the most resources and how they contribute to the overall advertising strategy.

Monthly cost analysis

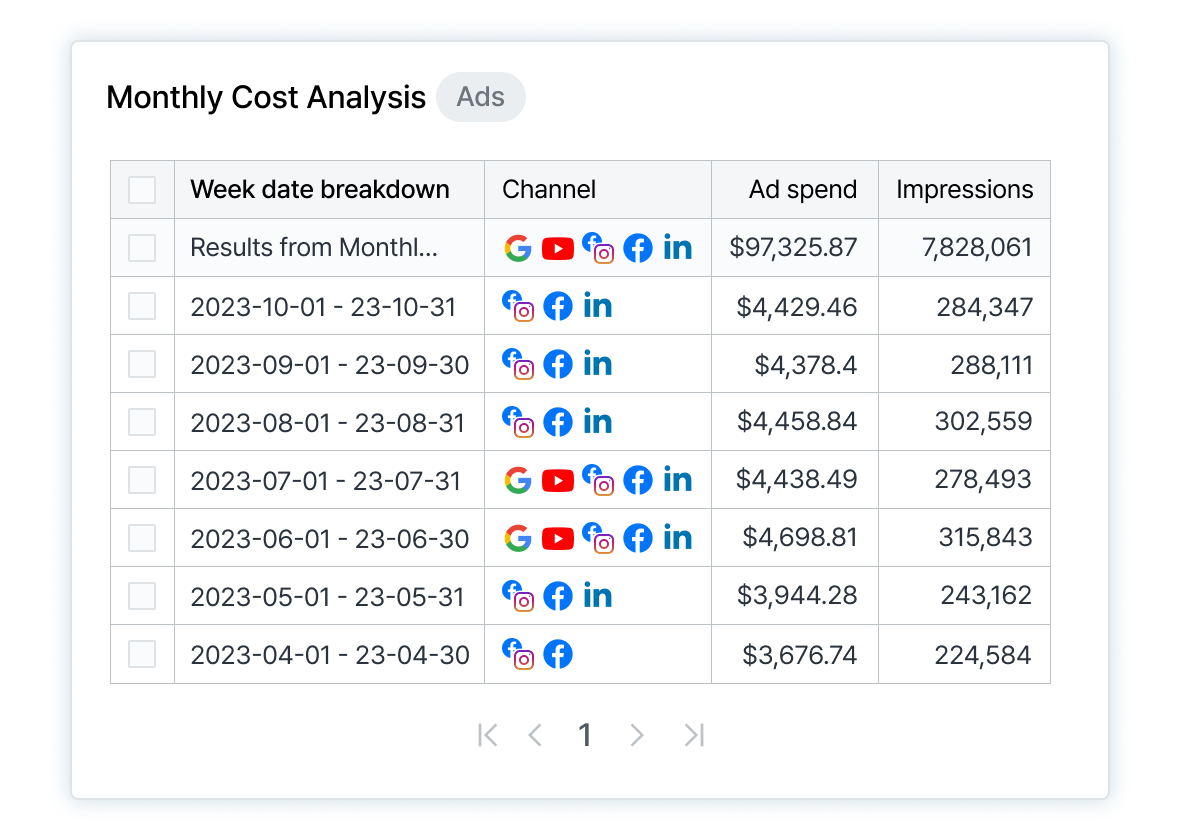
Monthly cost analysis section breaks down cost and marketing metrics on all channels by month. This includes:

Monthly cost trends by channel

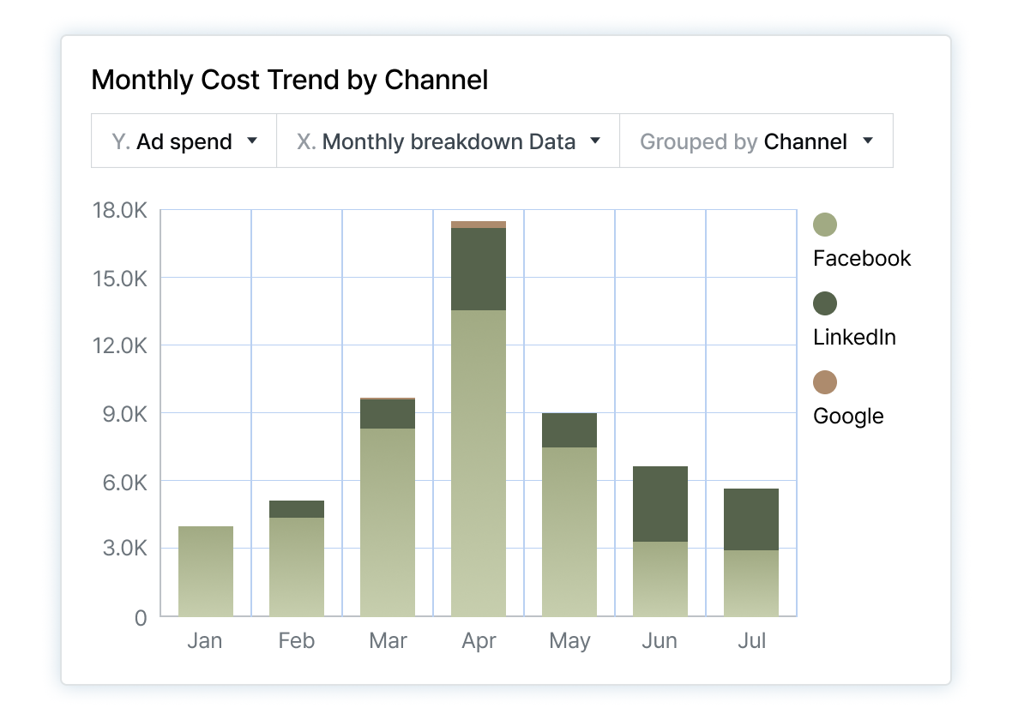
This is a bar graph that displays advertising spend over time on various channels, such as Google Search, Google Display, LinkedIn, Facebook, etc. 


This graph helps you see how your ad spend fluctuates each month and compare the spending across different channels.

Trends by day of week

Similar to “monthly cost analysis”, this section breaks down cost and key metrics by day of the week.

Ad spend by day of week

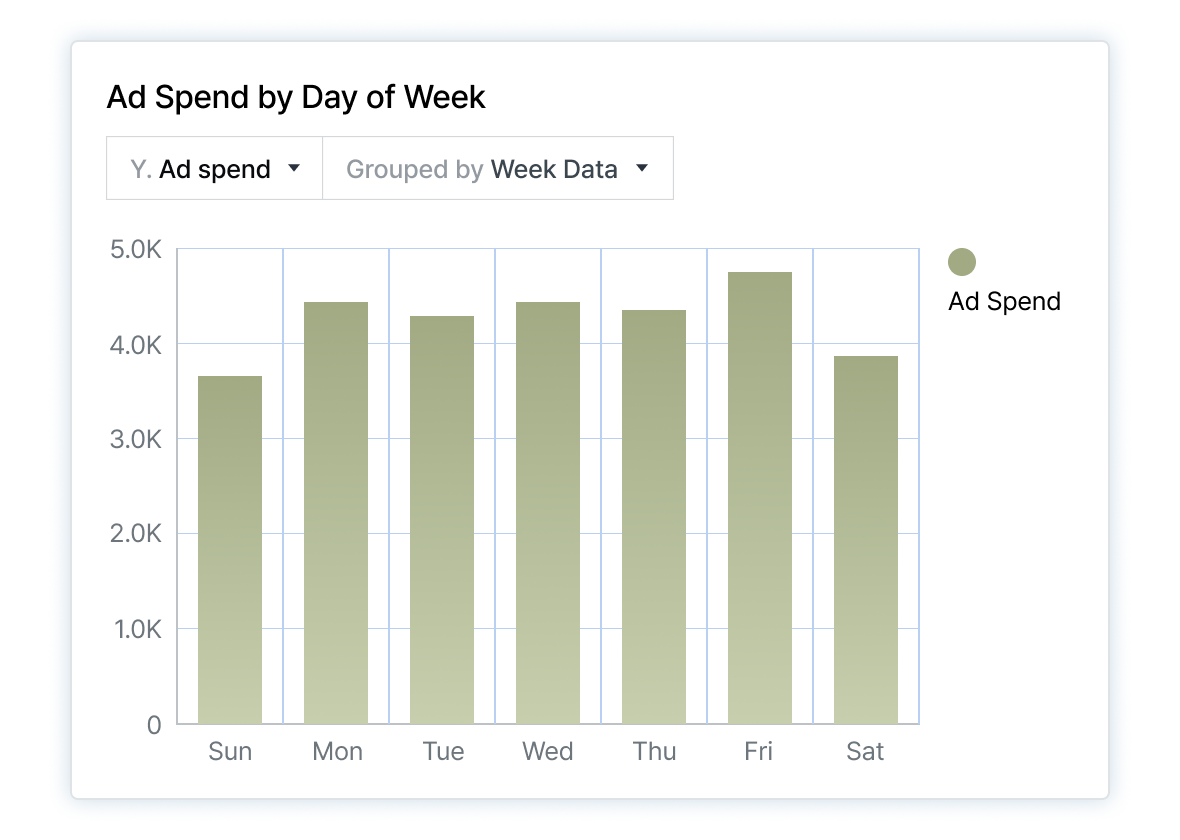
This is also a bar graph that illustrates the fluctuations in ad spending for each day of the week, so you can analyze which days incur higher ad costs and make better budgeting decisions.

Ad spend by demographics (country, age, and gender)

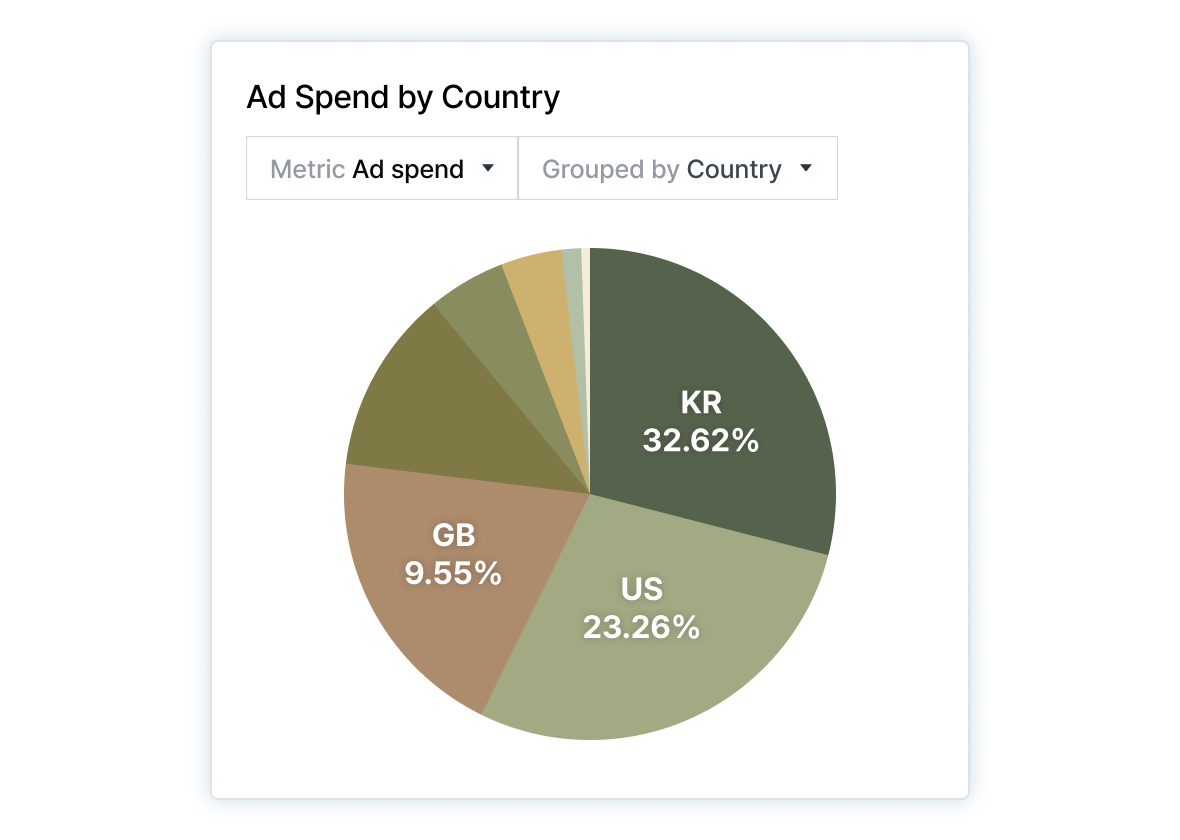
Ad spend by demographics takes a granular look at where advertising dollars go in terms of audience segments. It includes three pie charts that categorize ad spend by country, age, and gender.

This helps you see which audience segments you’re spending most on to reach with their ads.

Ad spend trends by demographics (country, age, and gender)

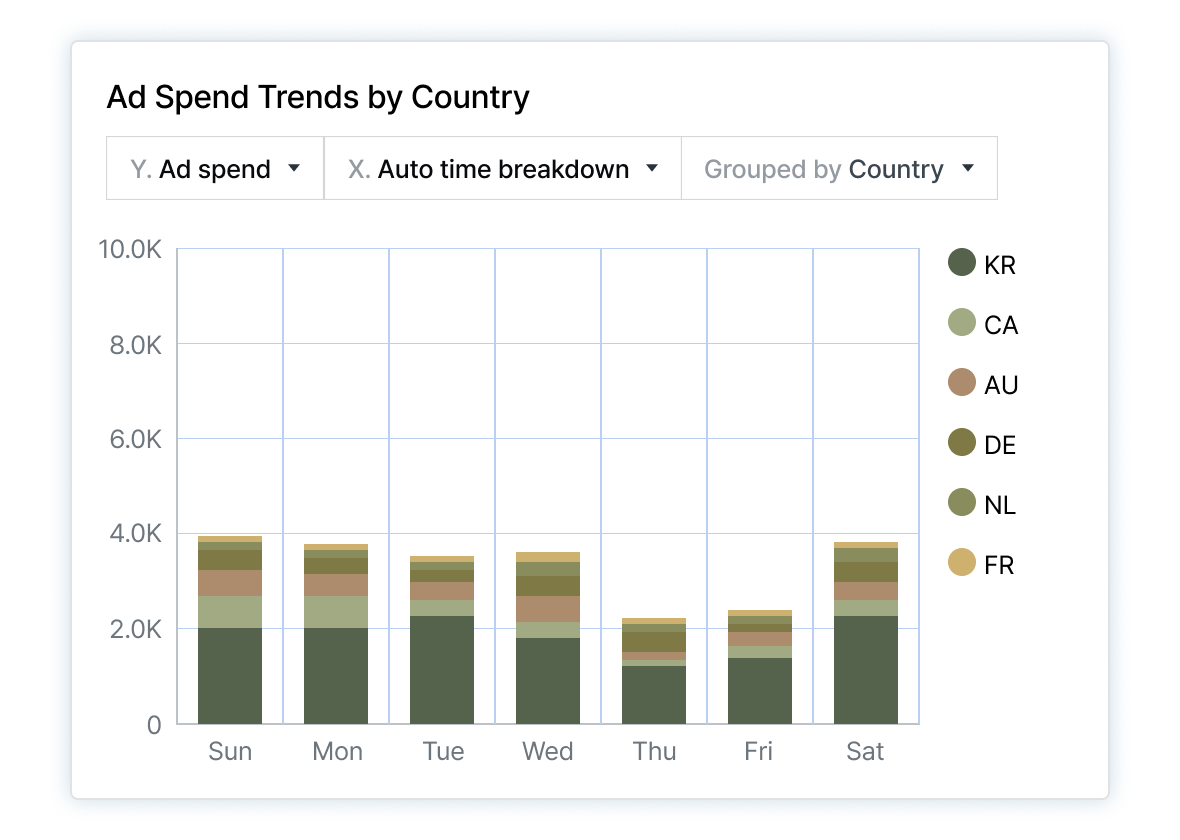
This section uses three bar charts to display how advertising spending changes based on country, age, and gender.

These charts help you see which demographics your ads are reaching the most, so you can adjust your marketing strategy accordingly.

How users are discovering you on Google
How long they are reading your content
How they’re interacting with pages on your website
How many times they visited you before converting
Here are the common site-centric data that marketers track:
No items found.

How do you make a KPI dashboard?

You should structure your marketing dashboard the way you write stories—with a clear beginning, middle, and end.
Divide your dashboard into three levels: top, middle, and bottom.
At the top, include:
  • Your brand / client’s visuals (name, logo, taglines)
  • Data stories
  • An overview of business metrics or compared with a specific time period
The middle section should analyze these KPIs in more detail:
  • Performance trends visualized in different types of graphs
  • Relationships between one KPI and another
  • Causes and effects
Finally, drill down to granular data:
  • Marketing mix
  • Details of ad campaignsAd creative insights (e.g. ad copy, photos, videos)Analysis of creative intelligence (e.g. keywords, colors, emojis)
  • Ad creative insights (e.g. ad copy, photos, videos)
  • Analysis of creative intelligence (e.g. keywords, colors, emojis)

What our customers are saying

Adriel made it easy for us to track our online ads across multiple platforms. The reporting process is now a lot more straightforward for my account managers, and our clients are in love with their new live dashboard. What a win!
J.Townley, Founder of Paparico
Marketing Agency
+140%
ROI
100%
Satisfied Clients
30h
Hours saved per week
Clicks Overview
Impressions
Impressions are the total number of times any of your webpages or your ads appear in search engine results and are viewed by users.

You can measure ad impressions through Adriel’s marketing dashboard across multiple ad channels, creatives, keywords, and audiences.
Link Clicks
Link clicks are the total number of times the links in your ad copy, call-to-action, or images have been clicked.

These links can lead to destinations within or outside of the platform where you’ve launched your ad, such as your landing page, social media profile, or a blog post. This is also a key metric for SEO.
Click-through rates (CTR)
Click-through rates measure the number of clicks you receive on an advertisement—per the number of impressions.

Generally, high CTRs mean that your ads were successful in attracting the attention of your target audience. High CTRs can also lead to lower advertising costs on advertising platforms like Google Ads. This article lists the average CTRs for all your favorite PPC channels.
Cost Overview
Cost-per-click (CPC)
Cost-per-click (CPC), similar to pay-per-click, is a popular programmatic advertising term where you pay an ad seller a cost every time someone clicks on an ad.

Different social media platforms, search engines, and programmatic publishers set different CPCs. They can range anywhere from $0.4 (Twitter Ads) to $6 (LinkedIn Ads). Get the average CPCs for your industry here.
Cost-per-mile (CPM)
Cost-per-mile (CPM) is the amount you pay for every 1000 impressions that your ad garnered. The CPM on different ad channels depends on a number of factors, such as the target audience, ad format, and the level of competition for ad space.
Cost-per-conversion (CPCV)
Everything comes with a cost, even conversions. Cost-per-conversion, or also known as cost-per-acquisition (CPA) pits the total revenue gained from an ad campaign against the total cost of that campaign.

CPCV is one of the easiest and most effective ways to determine if your ads are working. If your CPCV is too high, it could mean you have the wrong keywords, visuals, target audience, or channel. This is why it’s important to have a PPC reporting tool that lets you see super granular data as well as essential KPIs.
Conversions Overview
Conversions revenue
Revenue is the most rudimentary metric you can track on your report, but it helps you and your clients understand which campaigns or channels are bringing in money and which are draining your wallet. When you have this data, you can devise well-informed strategies in the future.

On Adriel’s PPC dashboard, you can view the total revenue for your ad campaigns across multiple digital channels, from LinkedIn Ads and Bing Ads to Walmart Connect.
Conversion rates (CVR)
Conversion rates (CVR) measure how many people took this desired action out of the total number of website visitors. Discover average CVRs by industry here.

Conversions are easier explained than measured, as they involve multiple circular paths from impressions to clicks to action on different marketing channels. But a PPC reporting dashboard reduces the hassle of having to go into each marketing channel and manually looking at each metric to arrive at conversions data.
Return on Ad Spend (ROAS)
When you pit revenue against ad spend, you get return on ad spend. ROAS measures the amount of revenue you earn for every $1 you spend on advertising. Find out what is regarded as a good ROAS ratio here.

Keeping track of your return on investment can be overwhelming when you have multiple campaigns running across different channels. Delegate the task to a reliable marketing dashboard but opt for one that comes with push notifications so that you don’t have to check back every ten seconds for potential fluctuations.

How do I report Meta Ads? What metrics do I show?

When reporting Meta Ads, you will want to visualize Instagram Ads and Facebook Ads performance side-by-side to understand how each platform is contributing to your digital marketing goals. Here’s how it looks like on Adriel’s report template:

Overview
An overview of key metrics on your Facebook and Instagram accounts.
Facebook
  • Followers
  • Fans
  • Impressions
  • Engagements
  • Reach
  • Profile views
Link Clicks
  • Followers
  • Engagements
  • Impressions
  • Profile views
Charts
A closer look at performance trends. Compare different metrics over a specific time period.
Facebook
  • Facebook Impressions/Profile views
Link Clicks
  • Instagram Impressions/Profile views
Posts
A deep dive of all your Instagram and Facebook posts.
Facebook
  • Facebook posts by
    • Impressions
    • Post engagement
    • Post comments
    • Post like
    • Post shares
Link Clicks
  • Instagram posts by
    • Impressions
    • Post engagement
    • Post comments
    • Post like
    • Post shares
Other metrics you can visualize:
  • Click-through rate (CTR): the ratio of impressions to clicks
  • Cost-per-click (CPC): the price you pay for each click on your Facebook ar Instagram ads
  • Cost-per-mille (CPM): the price you pay for every 1000 impressions
  • Conversion rates: the ratio of ad impressions or clicks that led to purchases or any other
    campaign goal
  • Cost-per-acquisition (CPA): the total cost of landing a new customer through Instagram or
    Facebook Ads

What is cross-platform analytics?

Cross-platform analytics refers to the ability to measure and analyze the performance of marketing campaigns across multiple platforms. This can include channels like:
  • Ad accounts: e.g. Google Ads, Meta Ads, LinkedIn Ads, etc.
  • E-commerce social platforms: e.g. Pinterest, Reddit
  • Programmatic platforms: e.g. Walmart Connect, The Trade Desk
  • Analytics tools: e.g. Google Analytics
  • Mobile analytics tools: e.g. AppsFlyer, Adjust
  • …and other sales and CRM tools
Check out our integration library to find out which platforms you can integrate to Adriel.
Cross-platform analytics helps agency owners and marketers identify areas where they need to make adjustments to optimize their ad spend. For instance, they can look at conversion and revenue figures and decide how to reallocate their budget across different marketing platforms.

What factors do we need to consider while making a digital dashboard?

To build an impactful cross-platform dashboard, you should consider:
The number of integrations
Most dashboard software in the market allows you to connect with anywhere from 60 to 600+ advertising and analytics platforms. The more connections, the better. Adriel supports integrations with 600+ channels and if there’s one that we don’t support natively, we can custom-make it for you.
Ease of use
It’s not just about the number of connections but also how easy it is to connect to these data sources.On Adriel, you can simply choose the platform you want to connect to from a drop-down list, and drag and drop widgets to start building your dashboards.
Real-time data
In a world where data is evolving every second, you need a dashboard that streams data as it comes in real-time so you can always see the latest campaign performance and take action in a timely manner.
Visualize ad creative data
Most dashboard software can show you all the main KPIs at a glance. But what if you want to dive deep into the details of your marketing campaigns? Adriel shows you granular data down to the ad level and allows you to report back on headlines, CTAs, and ad copies that led to higher conversion rates.
Alert system
Look for a dashboard software that alerts you whenever campaign metrics go above or below a certain KPI. With Adriel’s cross-channel alarm system, you can take advantage of opportunities and fix issues immediately.
White label reports
When it comes to client reporting, it’s very time-consuming to manually build complex dashboards in Google Data Studio or beautify your reports on PowerPoint. With Adriel, you can generate PDF reports with your brand visuals and client logos and colors within minutes.
1
Create an account
Book a Demo to get started. After your demo, we'll send you a link to sign up to Adriel for 14 days free. We'll also help you choose a pricing plan that suits your needs.
2
Connect data sources
Simply choose from a drop-down list to import dimensions and metrics from your ad accounts, analytics tools, and mobile measurement partners. See this page for a full list our integrations.
3
Visualize your data
Use our ready-made templates to instantly see all your KPIs in minutes. Or, start from a blank page and choose your data visualization widgets and graph types.

A Comprehensive All-in-One Marketing Reporting Dashboard to Monitor All Your Paid Media KPIs

Easily Track Paid Campaign Results in a Single Marketing Reporting Dashboard

Integrate all your paid ad channels’ results into one marketing reporting dashboard. Curious to know how your Meta, Google, or TikTok Ads are performing? Connect all of these platforms to Adriel, and in less than 5 minutes, show all of your paid campaign results in one unified dashboard. See our integrations page for more information.

White-Labeling & Customization
In Our Marketing Reporting Tool

Our software was expertly designed with powerful functions for marketers. But everything can be customized. Adriel’s flexibility allows you to change all aspects of the dashboard design and appearance. Impress your clients with a professional marketing reporting dashboard report for an expert brand image.

Create an Insightful
Advertising Cost Analysis Dashboard
Using Our Pre-made Templates

You can start from a blank page to create a marketing reporting dashboard, but what if you don’t have time? Our extensive pre-made marketing reporting dashboard library has everything you might need. Try Adriel, and you’ll have more time to research ways to increase conversion or optimize your landing pages.

Other Dashboard Examples

PPC Dashboard
Have pay-per-click campaigns on different channels? A PPC dashboard aggregates and displays all your key insights in one place so you can optimize for higher ROAS.
Social Media Dashboard
Paid social campaigns are critical for brand awareness and conversions. See marketing dashboard examples to track campaign performance in real-time.
Manager Dashboard
Keep on top of all the critical information the management needs to know in order to make decisions with our ready-to-go manager dashboards.

Why Leading Advertisers Choose Adriel

Eliminate manual reporting
Spend more time acting for impact and less time on repetitive tasks
Foolproof your data
Say goodbye to data translation risks with automated data transfers and harmonization
Get real-time alerts
Automatically track KPIs and insure all your campaigns against unforeseeable errors
Drive better performance
Access a full suite of creative intelligence tools designed to help you maximize performance
White label your work
Generate beautifully branded reports your clients will love in minutes
Offer better services
Get more time to do what you love and build more trustworthy relationships

What our customers are saying:

Revenue
+170%
Management Cost
-20%
Hours saved per week
45h
I was always asking for reports from my teams but by the time I got them it was too late to capitalize on some important insights, which hindered our growth. Now I just sign in to Adriel and see everything for myself as it happens.
J.Riley, CEO of Edge
Digital Agency
ROI
+140%
Satisfied Clients
100%
Hours saved per week
30h
Adriel made it easy for us to track our online ads across multiple platforms. The reporting process is now a lot more straightforward for my account managers, and our clients are in love with their new live dashboards. What a win!
P. Townley Jones, Founder of Paparico
Marketing Agency

FAQs

All your questions answered. And if you can’t find it here, chat to our friendly team.
Why should you have a dedicated dashboard to track advertising cost?

A dedicated cost dashboard automates and streamlines ad spend analysis for marketing teams. Here are some benefits you can get out of it:

  • Automation: Simplifies data collection, reducing manual effort.
  • Centralization of Marketing Data: Keeps all ad spend data in one place for easy access.
  • Informed Decision-Making: Facilitates smarter choices with consolidated data.
  • Actionable Insights: Provides clarity on which tactics work, aiding in quick adjustments.
  • Campaign Optimization: Helps fine-tune ad spending for better performance.
  • Alignment with Marketing Goals: Ensures ad budgets are directly contributing to objectives.
  • Streamlined Process: Makes managing and reporting on ad spend more efficient.
What is the best digital marketing dashboard?

The best marketing performance dashboard for you will depend on the size of your business, your budget, and the number of features you require.

Here are the top players in the market:


1.Adriel: a business intelligence platform built for marketers, advertising specialists, marketing agency owners, and data analysts.

Adriel Features:

✅ 650+ easy data connectors through APIs

✅ Real-time, interactive marketing dashboards

✅ Custom alerts and metrics

✅ ETL and data prep

✅ Custom reports and dashboards

✅ Marketing reporting templates

✅ Ad creative insights

✅ Complete marketing command center (edit multichannel campaigns directly from Adriel)

Cost: US$299-$1499/month or custom pricing


2.DashThis: a marketing reporting tool designed to simplify the process of gathering data from multiple platforms and presenting it in a coherent, easy-to-understand format.

DashThis Features:

✅ 34+ data connectors

✅ Custom metrics

✅ Custom dashboards

Cost: From $33/mo/3 dashboards to $1000+/mo


3.Google Data Studio (Looker Studio): a free centralized dashboard software for businesses of all sizes.

Google Data Studio Features:

✅ 150+ data connectors

✅ Customizable dashboards

✅ Real-time collaboration

Cost: Free for basic use but advanced connectors may incur a fee.

4.Whatagraph: a cloud-based reporting platform designed to simplify the process of generating marketing performance reports.

Whatagraph Features:

✅ 40+ data integrations

✅ Custom metrics

✅ Custom reports


Cost: From $223 to $585+/mo


5.AgencyAnalytics: an all-in-one business intelligence and reporting tool for SMBs and marketing agencies.

AgencyAnalytics Features:

✅ 75+ data connectors

✅ Real-time dashboards

✅ Custom, whitelabeled reports


Cost: From $12/mo/campaign to $900+/mo

What does a good cost and marketing dashboard look like?

An effective business intelligence tool is both a strategic dashboard and an operational dashboard at the same time.

Top-level executives should be able to see a high-level view of marketing KPIs right off the bat, but also be able to drill down to granular data and uncover which channels or advertisements are successful in reaching business goals.

Having the option to invite different members of the executive team with different access rights and views would also help greatly. For instance, a CFO should have access to a particular set of performance metrics, while a CMO should have access to another.

In terms of user experience, a simple, clear, and easy-to-read user interface would lead to better analysis and informed discussions across the executive team.

But the work of dashboard software doesn’t end at visualization. You should be able to export this data into a PDF or a CSV report and share it with different stakeholders through unique links.

This is especially helpful if you’re a marketing agency that needs to report to your clients regularly so they can stay informed on the performance of your initiatives.

Check out this article for more dashboard examples!

Take control of your marketing data today

Thank you! Your submission has been received!
Oops! Something went wrong while submitting the form.
Don't Go!
Book a 1:1 Demo Instead.
We’ll help you optimize your Ad Operations processes and save thousands of dollars every month on ad spend and reporting.
Thank you!
You will be redirected shortly.
Oops! Something went wrong while submitting the form.