Claim Your Free eBook: The Definitive Guide to Ad Operations

Cross Platform Dashboard Template for All Your Ad Campaigns

Automate the entire process of aggregating your ad data from multiple platforms with a cross-platform dashboard. Monitor key metrics in real-time, reallocate budget, A/B test creatives, and generate reports on a single dashboard.

Need a custom reporting or dashboard template?
We got you covered.

Get your free custom template within 48 hours

Have a report you’d like us to replicate, or need some extra assistance? Get in touch with us and we’ll build a template within 48 hours free of charge to help you evaluate Adriel for your business’ specific goals.
Book your 1:1 Consultation

What is cross-platform analytics?

Cross-platform analytics refers to the ability to measure and analyze the performance of marketing campaigns across multiple platforms. This can include channels like:
  • Ad accounts: e.g. Google Ads, Meta Ads, LinkedIn Ads, etc.
  • E-commerce social platforms: e.g. Pinterest, Reddit
  • Programmatic platforms: e.g. Walmart Connect, The Trade Desk
  • Analytics tools: e.g. Google Analytics
  • Mobile analytics tools: e.g. AppsFlyer, Adjust
  • …and other sales and CRM tools
Check out our integration library to find out which platforms you can integrate to Adriel.
Cross-platform analytics helps agency owners and marketers identify areas where they need to make adjustments to optimize their ad spend. For instance, they can look at conversion and revenue figures and decide how to reallocate their budget across different marketing platforms.

What factors do we need to consider while making a digital dashboard?

To build an impactful cross-platform dashboard, you should consider:
The number of integrations
Most dashboard software in the market allows you to connect with anywhere from 60 to 600+ advertising and analytics platforms. The more connections, the better. Adriel supports integrations with 600+ channels and if there’s one that we don’t support natively, we can custom-make it for you.
Ease of use
It’s not just about the number of connections but also how easy it is to connect to these data sources.On Adriel, you can simply choose the platform you want to connect to from a drop-down list, and drag and drop widgets to start building your dashboards.
Real-time data
In a world where data is evolving every second, you need a dashboard that streams data as it comes in real-time so you can always see the latest campaign performance and take action in a timely manner.
Visualize ad creative data
Most dashboard software can show you all the main KPIs at a glance. But what if you want to dive deep into the details of your marketing campaigns? Adriel shows you granular data down to the ad level and allows you to report back on headlines, CTAs, and ad copies that led to higher conversion rates.
Alert system
Look for a dashboard software that alerts you whenever campaign metrics go above or below a certain KPI. With Adriel’s cross-channel alarm system, you can take advantage of opportunities and fix issues immediately.
White label reports
When it comes to client reporting, it’s very time-consuming to manually build complex dashboards in Google Data Studio or beautify your reports on PowerPoint. With Adriel, you can generate PDF reports with your brand visuals and client logos and colors within minutes.

What are the steps to create a cross-platform dashboard?

Creating a cross-platform dashboard is as easy as 1-2-3 with Adriel’s no-code SaaS marketing platform. You just need to choose your data-source from a drop-down list and start using our ready-made templates or customize your own with interactive widgets and graphs. The software will display all your data in a few minutes.No coding and technical knowledge required.All you need to do is:
1
Create an account
Sign up for Adriel with your email for 14 days free. Afterwards, choose a pricing plan that suits your needs.
2
Connect data sources
Simply choose from a drop-down list to import dimensions and metrics from your ad accounts, analytics tools, and mobile measurement partners. See this page for a full list of integrations.
3
Visualize your data
Use our ready-made templates to instantly see all your KPIs in minutes. Or, start from a blank page and choose your data visualization widgets and graph types.

A Comprehensive All-in-One Cross-Platform Dashboard to Monitor All Your Paid Media KPIs

Easily Track Paid Campaign Results in a Single Cross-Platform Dashboard

Integrate all your paid ad channels’ results into one cross-platform dashboard.
Curious to know how your Meta, Google, or TikTok Ads are performing? Connect all of these platforms to Adriel, and in less than 5 minutes, show all of your paid campaign results in one unified dashboard. See our integrations page for more information.

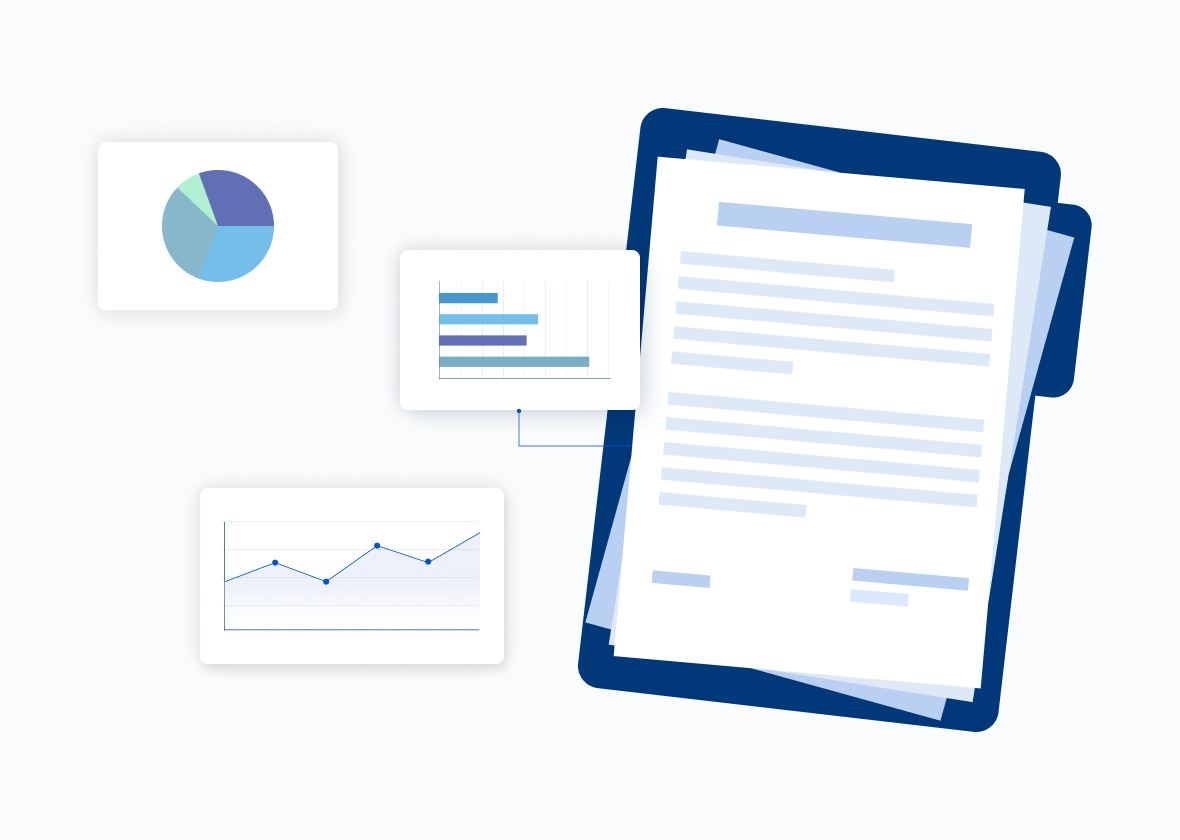
Create an Insightful Cross-Platform Dashboard Using Our Pre-made Templates

You can start from a blank page to create a cross-platform dashboard, but what if you don’t have time?Our extensive pre-made cross-platform dashboard library has everything you might need. Try Adriel, and you’ll have more time to research ways to increase conversion or optimize your landing pages.

White-Labeling & Customization In Our Cross-Platform Reporting Tool

Our software was expertly designed with powerful functions for marketers. But everything can be customized. Adriel’s flexibility allows you to change all aspects of the dashboard design and appearance. Impress your clients or executives with a professional cross-platform dashboard report for an expert brand image.

Why Leading Advertisers Choose Adriel

LG
Clarins
Decathlon
wadiz
Amore Pacific
CJ ENM
Eliminate manual reporting
Spend more time acting for impact and less time on repetitive tasks
Foolproof your data
Say goodbye to data translation risks with aoutomated data transfers and harmonization
Get real-time alerts
Automatically track KPIs and insure all your campaigns against unforeseeable errors
Drive better performance
Access a full suite of creative intelligence tools designed to help you maximize performance
White label your work
Generate beautifully branded reports your clients will love in miunutes
Offer better services
Get more time to do what you love and build more trustworthy relationships

What our customers are saying:

Revenue
+170%
Management Cost
-20%
Hours saved per week
45h
I was always asking for reports from my teams but by the time I got them it was too late to capitalize on some important insights, which hindered our growth. Now I just sign in to Adriel and see everything for myself as it happens.
J.Riley, CEO of Edge
Digital Agency
ROI
+140%
Satisfied Clients
100%
Hours saved per week
30h
Adriel made it easy for us to track our online ads across multiple platforms. The reporting process is now a lot more straightforward for my account managers, and our clients are in love with their new live dashboards. What a win!
P. Townley Jones, Founder of Paparico
Marketing Agency

Save time on reporting and focus on what matters with Adriel.
Try it now for 14 days free.

Or get started free today
Thank you!
You will be redirected shortly.
Oops! Something went wrong while submitting the form.

FAQs

All your questions answered. And if you can’t find it here, chat to our friendly team.
How can a dashboard be useful for business?
Here are three main ways a dashboard can be useful for your business:

1. Contextualization: In the digital marketing landscape, there’s simply too much data for even the brightest analytics whiz to be able to connect the dots between disparate data points in their raw state.

But with a business intelligence dashboard, you’ll be able to see this data in context in digestible widgets and graphs.

2. Automation: Dashboards eliminate manual workflows and spreadsheets that would otherwise eat up a great deal of time and prevent your team members from working on needle-moving tasks.

3. Faster reporting: Self-service manager dashboard software like Adriel offers a white-labeled reporting feature that allows both business users and end-users to put together reports packed with real-time insights and intuitive data displays.
What kind of metrics should I track on my cross platform dashboard?
These are the most common metrics that marketers track on their digital dashboards:

1. Revenue
2. Ad spend
3. Return on ad spend
4. Impressions
5. Cost-per-click (CPC)
6. Click-through rate (CTR)
7. Conversion rates
8. Cost-per-conversion (CPCV)
9. Link clicks
10. Bounce rates

Check out this article for a full breakdown of metrics!
Is it easy to use a cross platform dashboard?
This depends on which software you ultimately choose to use for your business.

We can’t speak for other dashboards, but Adriel is built to be as easy to use as possible.
You just need to choose the data source you want to connect to on our drop-down list, and you’ll get all the data from that source on one interface in minutes. No need to write codes, no need to have technical knowledge beforehand.
To display your business data, simply drag-and-drop ready-made widgets and determine dimensions for tables, graphs, and charts.

Adriel also supports interactive data - which means you can directly turn ad campaigns on/off, allocate budget, and edit campaign details on our dashboard.

Try Adriel for your team

14-day free trial | No credit card needed

Start Free
Thank you!
You will be redirected shortly.
Oops! Something went wrong while submitting the form.