.svg)


.png)
Whether you’re a fast-growing marketing agency or an enterprise CMO, a digital marketing reporting dashboard is essential to stay on top of all your advertising campaigns. Tapping into superstar software will go a long way to help hit your ROAS goals and scale your business further.
So, what separates specific software from the rest of the pool? Three things.
A superstar software should…
All of this without spending hours after hours connecting data sources and configuring compatible machine learning models, just to spend a fortune on onboarding and deployment once everything’s set up?
Though it may sound too good to be true, all of this is perfectly attainable with the right marketing intelligence tool. That’s also part of why we’ve put together this guide–to help marketers like yourself find the right automation tool to take digital marketing to another level.
Despite the widespread adoption of multichannel marketing, two-thirds of marketers still struggle with data integration, timeliness, and accessibility. Other challenges include figuring out targeting, budgeting, and proper tracking, according to a survey by Statista.

These problems can be solved with the right digital reporting marketing dashboard; the most crucial tool in your growth arsenal. By compiling all your data into a centralized repository, a digital marketing reporting dashboard acts as a single source of truth that allows for efficient, agile decision-making and problem-solving.

In this guide, we will discuss:
Let’s go!

A digital marketing reporting dashboard is a business intelligence tool that collects, analyzes, and populates data from different sources on a user interface.
If you have multiple marketing campaigns running across different platforms like Facebook and Google, a reporting tool can pull all the data from each campaign through data connectors, and turn this data into actionable insights.
Data connectors let you integrate various marketing channels in one centralized location without writing backend codes yourself.
However, most marketing performance dashboards in the market ask users to configure settings before pulling in data. This can be confusing if you don’t know what you’re looking for.
A good digital marketing platform acts as a command center. It lets you see all your media, messaging, and performance so you can make real-time decisions based on how the market is responding to your creatives and whether your targets are moving towards purchase.
Read on for how to use a dashboard for real-time business insights and templates and examples to get started.
Online marketing dashboards visualize key performance indicators (KPIs) for your PPC, social media marketing, email marketing, and content marketing campaigns. If you’re an eCommerce brand, you can see how your ad campaigns are driving sales and revenue on a marketing dashboard.
Typical marketing metrics and KPIs that you can track on your dashboard include:

To understand why having a data visualization dashboard is so important, compare the images on the left and right. While the left appears as a random concoction of numbers, the scatter plot on the right makes plain the positive correlation binding the variables together.
That’s the power of visualization. It harnesses the ability to unlock hidden patterns, making it possible to connect the dots between disparate data points at once.
For marketers who must repeatedly ask loaded questions, such as from which acquisition funnels lead to conversion, during which time of the day are prospects most active, and the like, data visualization can help cut through the pile of raw data standing in the way of getting those questions answered.
To understand the types of visualization that will power your marketing insights and drive campaign performance, such as scatter plots, word clouds, and pie charts, check out this story from Venturebeat in which our very own Sophie Eom, takes a deep dive into harnessing the power of data visualization to tap into the pulse of marketing on VentureBeat.
We designed Adriel to have all of these data visualization features so can analyze cross-platform data in detail: get all data in one place, and get insights for growth through CMO dashboard data visualization.

Most popular data visualization tools in the market are extremely difficult to set up, requiring SQL or LookML skills. If you're currently using Tableau and struggling to set it up, check out 5 easier and faster Tableau alternatives.
But with a no-code dashboard like Adriel, you can easily connect to your data sources and see all your key metrics and KPIs in minutes – not hours or days. All you need to do is:
Adriel automatically extracts the data you want to see, harmonizes it to improve accuracy, and displays digestible KPIs, trends, and relationships on the dashboard.
Here are some of our most popular templates for marketers:
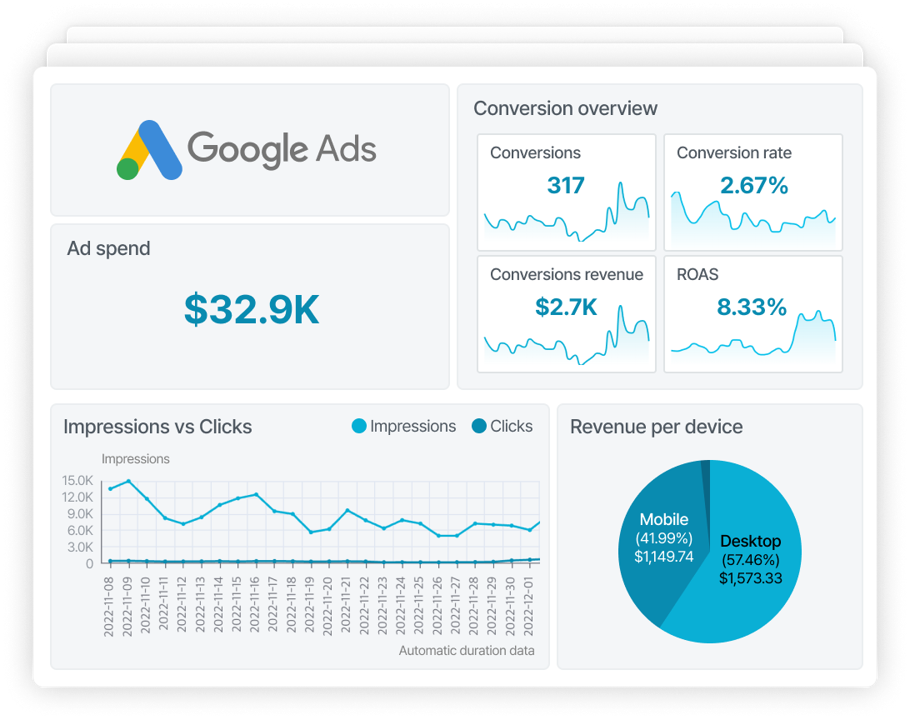
If you have hundreds of PPC ad campaigns across multiple channels, a PPC dashboard template can save you hundreds of hours on tedious, manual data stitching. Manage all your campaigns in one place, track KPIs in real-time, compare performance, and dig into ad creative data.
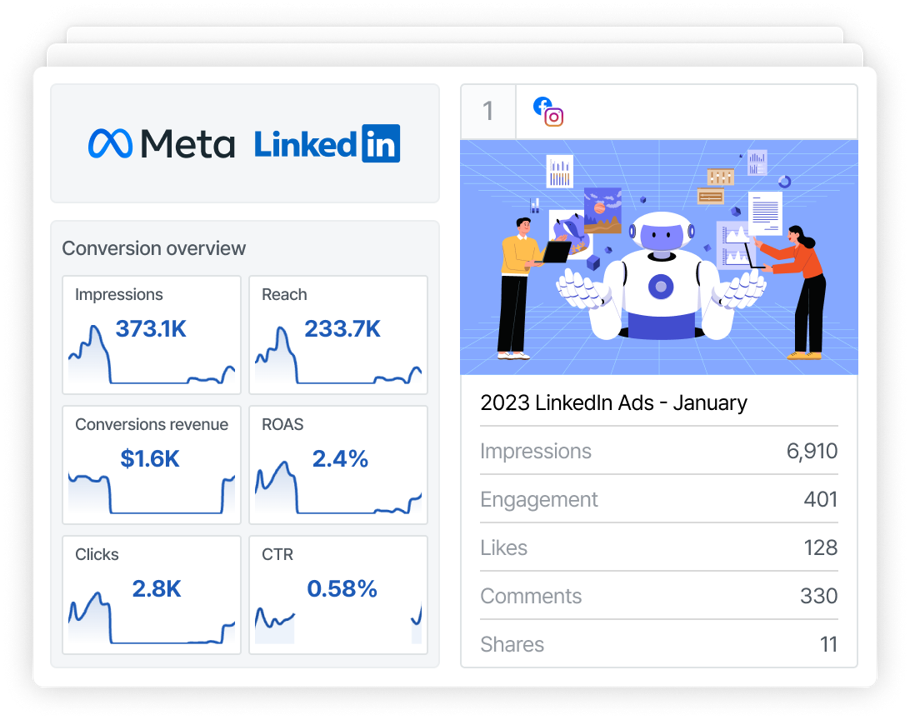
Have paid social media campaigns across Meta, TikTok, LinkedIn, Snapchat, and more? No more running from one platform to another. With a social media dashboard template, you can stay on top of social marketing efforts, A/B test ad creatives natively, and track followers and like counts easily.
If you are a marketing agency, a performance dashboard template will give you unique insights to supercharge growth for your clients. See an overview of key metrics, set custom alerts to track performance changes, and turn off campaigns and ads that are draining money right on the dashboard.
Need help putting together marketing reports for different clients and/or managers? Create white-labeled reports with each client’s logo and colors in minutes, and share them as PDFs, CSVs, or unique links that lead back to a live marketing reporting dashboard template.

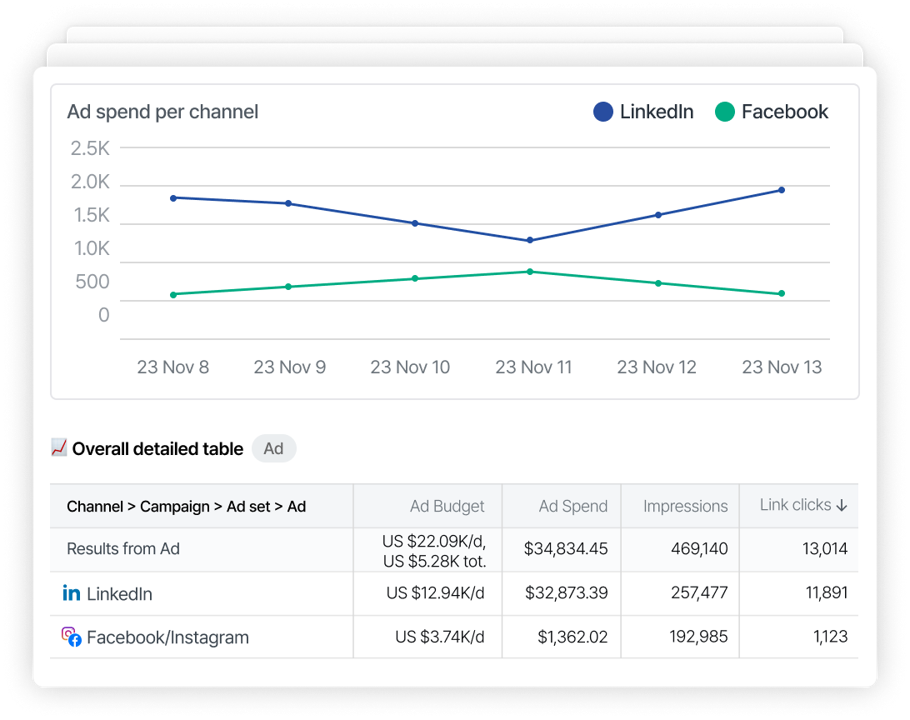
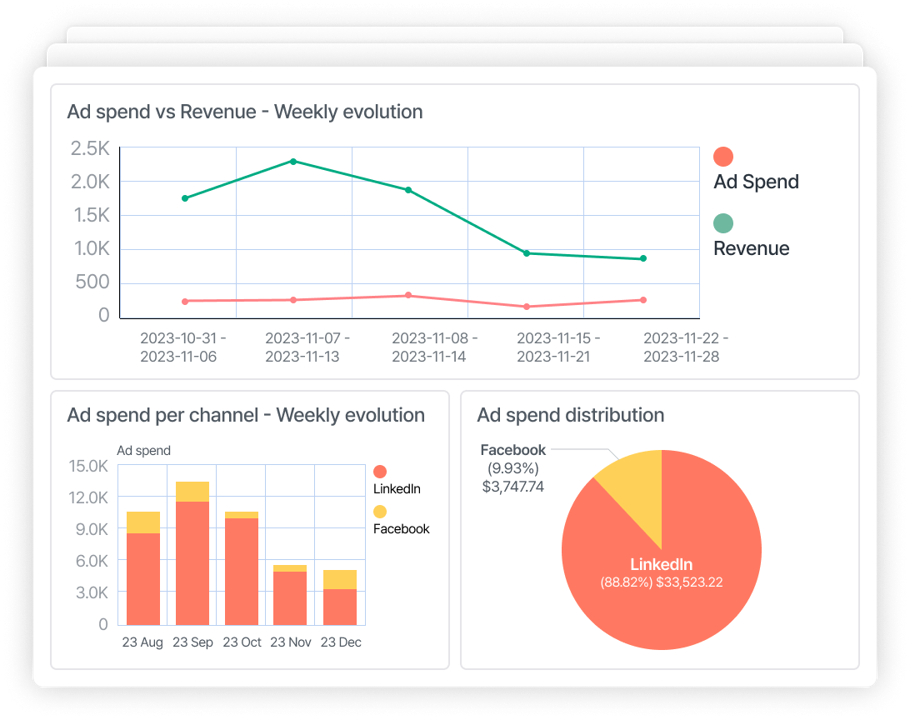
Automate the entire process of aggregating your ad data from multiple platforms with a cross-platform dashboard template. Monitor key metrics in real-time, turn campaigns ON/OFF, reallocate budget, A/B test creatives, and generate reports in one place.
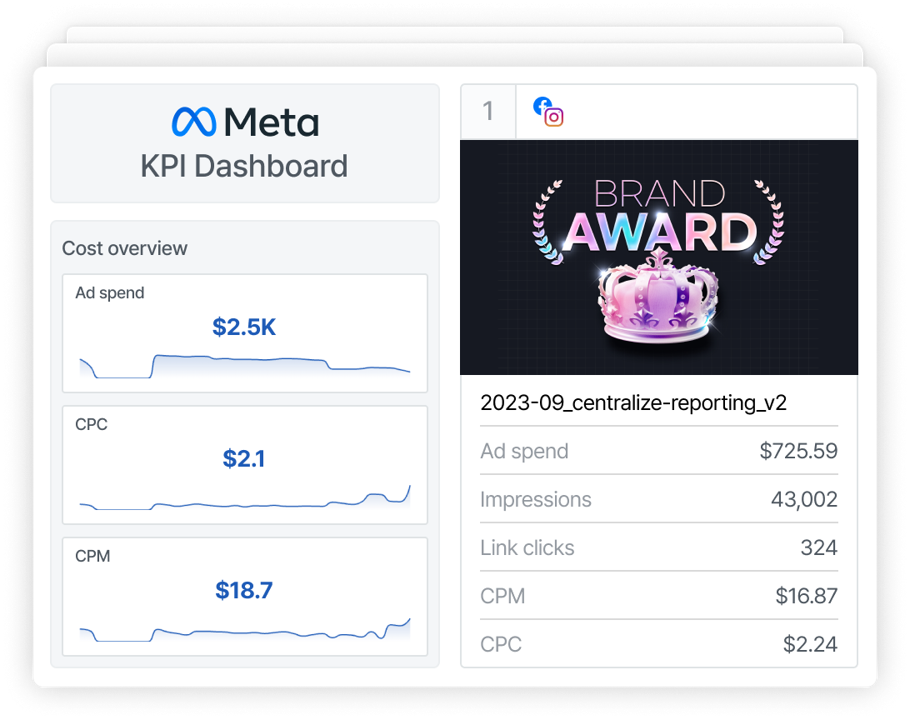
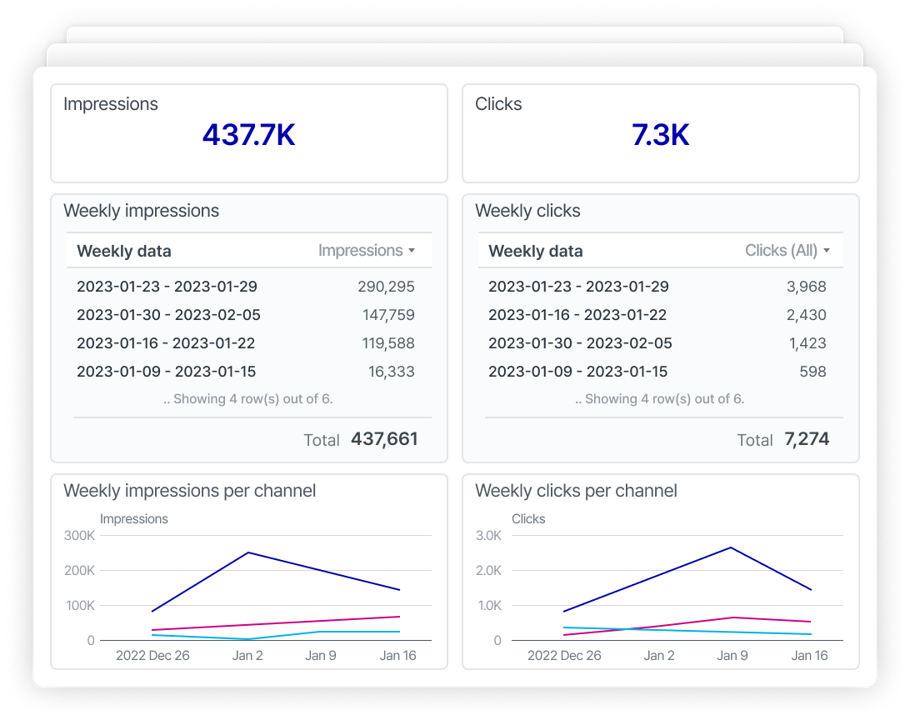
Just want to track your key performance indicators and nothing else? No problem. Pick three to five KPIs to display on a KPI dashboard template and hone in on the numbers that matter the most.

Get all the important data you need to make faster decisions on a manager dashboard template, and create different reports for different managers. Download white-labeled reports in minutes!
Quickly see an overview of key metrics and make decisions in a snap on an executive dashboard template. Tell compelling stories about how marketing activities led to better business performance.

Running ad campaigns for your eCommerce business? Aggregate data from all popular eCommerce ad platforms like Walmart Connect and Amazon Ads and see key metrics on an eCommerce dashboard template.

No more figuring out GA4. Build a stunning Google Analytics 4 dashboard in minutes using drag-and-drop widgets and API connectors. Get started with this GA4 dashboard template for 14 days free.
Explore all 27 templates here!

As omnichannel marketing becomes the norm for reaching target audiences, marketers find themselves spending too much time processing, unifying, and merging siloed cross-platform data for the sake of readability.
The more platforms involved, the more complex this process becomes, and the more time is spent on these manual yet vital tasks. Data stitching can often lead to human errors, and manual processes inevitably lead to delays in key decision-making.
Managing multiple marketing channels, campaigns, creatives, logins, data sets, and spreadsheets puts a heavy and frustrating strain on marketing teams. Insights are delayed, decision-making is pushed back, and ad spend is wasted on inefficient campaigns.
We understand these frustrations. When we created Adriel, we wanted to help marketers automate tasks and leverage a single source of truth to streamline creative development, strategic planning, and campaign execution. We also understand that the future of advertising is AI, and we're actively working on cool new AI tools in our marketing dashboard.
Here are five of the biggest benefits we’ve built into Adriel to power business insights:

For agencies, you can easily manage all your clients’ marketing campaigns from a single place without the hassle of exporting and importing data into spreadsheets.
Whether you’re juggling 10 or 100 accounts, an automated marketing and agency dashboard is not only more cost-effective than hiring multiple account managers, but also lets you automate your reporting so you can grow and scale your marketing agency.

Have you ever had to manually select all the different metrics you want to import and get frustrated because of how complex it was?
Adriel is designed to be truly plug and play: no code or dev needed so you can easily get your workspace to set up in minutes, even if you are switching from another marketing dashboard software.
Adriel covers the whole marketing spectrum from Amazon Ads to Zoho CRM and integrates easily. If there is an integration we do not support natively via API, a Google spreadsheet integration will do the trick.
Check out our full list of platform integrations.

Most marketing dashboard software on the market don’t have this function built in, but the ability to set alarms is huge in saving time and making quick decisions for agencies.
With Adriel’s real-time alert function, you can track KPIs to stay on top of their budget allocation. Marketers can eliminate money leaking campaigns and scale winning ones in just a few clicks.
We’ve also upgraded our alarm system in 2023. You can now apply alerts to specific data sources, ad sets, ad campaigns, individual ads, and every single metric available on the dashboard, including custom metrics.
There are also now more customization options available. You can:
Adriel’s alarms work around the clock to monitor your multi-channel attribution so that you can stay confident you are making the best investments at all times.

With Adriel, agency users can both create in-depth dashboards for internal management (Agency overview, client/team overview, etc.), and client-facing dashboards.
Agency clients can also be invited to Adriel to access a real-time reporting dashboard. White-label your work by creating beautiful marketing reports instantly customized to each client’s specific needs, interests, and priorities with brand visuals, and impress your clients.

Visual learners will love this. The ability to see ad creatives directly within your performance reports make exploring data so much more intuitive so you know exactly what creatives work best.
You no longer have to login to different platforms and can manage all of these in one place, which is incredibly helpful for an agency.

Load up a word cloud, which analyzes words across different ads through color-coded visualization to show you high performing words. Manscaped, an American-based male grooming company, used this feature to figure out which keywords worked best for new global markets, and found out that Middle Eastern men much prefer the word “hygiene” to “beard trimming” and supercharged their campaign performance.
As agency owner Isabel, of Ingrid of Ingrid, shares: “I never look at my business in a vacuum. Media and messaging should work hand-in-hand as a holistic media strategy. As a business owner, my media and marketing departments need to look at the whole business to make real-time decisions: from the creatives to how the market is responding to ads. Adriel helps us make these live decisions, everyday.”
Check out our complete Creative Intelligence Suite.
We hope this guide has been helpful in understanding:
We also showcased marketing dashboard examples and templates that you can get started immediately with. If you are a marketer, a digital marketing dashboard is a crucial business intelligence tool in your growth arsenal.
By bringing together multichannel campaigns’ most valuable metrics together into a single KPI dashboard, this is the marketing command center you need to scale your agency, save time, and supercharge campaign performance and Return on Ad Spend.
Book a demo today and experience how easy it is to get all your data in one place.


.png)
.png)
.png)